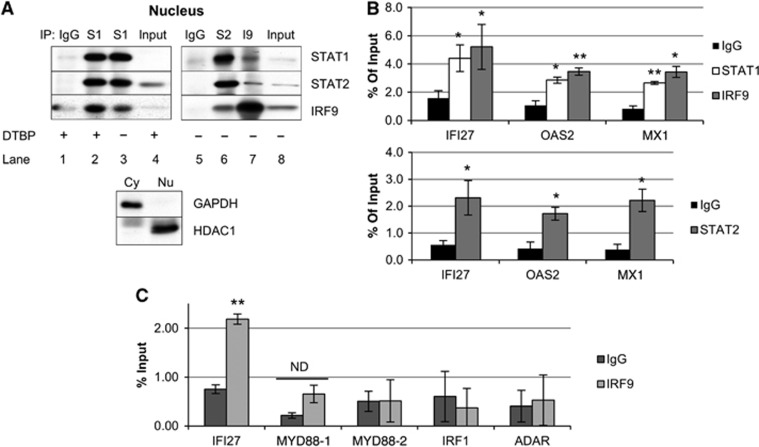
Figure 4.
U-STAT1, U-STAT2, and IRF9 form U-ISGF3, which binds to ISREs on the target gene promoters. hTERT-HME1 cells expressing high levels of U-STAT1, U-STAT2, and IRF9 without IFN stimulation were analysed by co-immunoprecipitation (Co-IP) and chromatin-immunoprecipitation (ChIP) assays. (A) Nuclear proteins were used for Co-IP with normal rabbit IgG or rabbit polyclonal antibodies against STAT1, STAT2, or IRF9. To stabilize protein–protein interactions, the nuclear fraction was treated with the cleavable cross-linker, dimethyl-3,3′-dithiobis-propinimidate (DTBP, lanes 1, 2, and 4). Mouse monoclonal antibodies against STAT1, STAT2, or IRF9 were used for the western method. The purity of the fractions was assessed by determining the levels of GAPDH (a cytoplasmic protein) and HDAC1 (a nuclear protein) in the input lysates by the western method. (B, C) Total protein lysates were cross-linked with 1% formaldehyde and the cell lysates were cross-linked with DTBP. Chromatin was sheared into <1 kb lengths by sonication. Rabbit polyclonal antibodies against STAT1, STAT2, or IRF9, or comparable amounts of normal rabbit IgG, were used for immunoprecipitations. Real-time PCR was performed to amplify the precipitated DNAs with primer pairs spanning ISREs in the promoters of IFI27, OAS2, MX1, MYD88, IRF1, and ADAR genes. MYD88-1 and -2 mean 2 different ISREs in the promoter of MYD88 gene. The amount of amplified DNA was calculated by using the standard curve method. The values (% input) are the percentages of DNA amount in immunoprecipitated samples compared to 2% input DNA. The data are represented as means of triplicate PCR analyses±s.d. ** represents P<0.01 and * represents P<0.05, by two-tailed t-test, compared to the IgG control. ND, not different statistically (P>0.05, by two-tailed t-test).
Source data for this figure is available on the online supplementary information page.

