Figure 6.
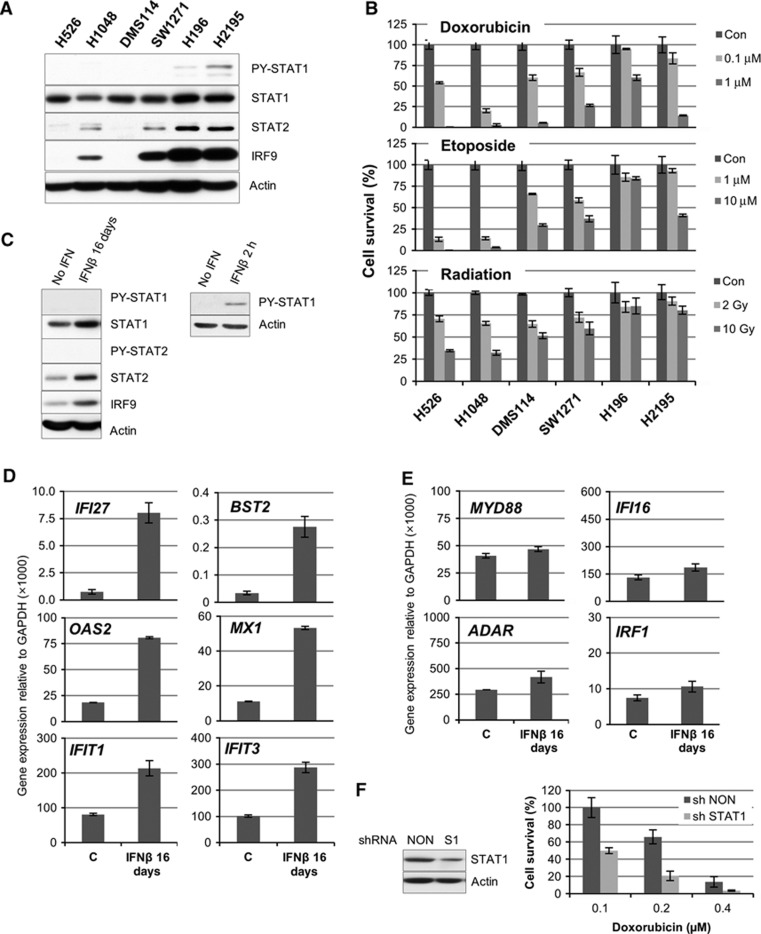
U-ISGF3 induced by chronic exposure to IFNβ confers resistance to DNA damage. (A) The expression of PY-701- or total STAT1, PY-690- or total STAT2, and total IRF9 was examined by the western method in six different small cell lung carcinoma cell lines. A signal for PY-690-STAT2 was not detected in any lane. (B) The six cell lines were treated with doxorubicin, etoposide, or radiation at the indicated doses. After 72 h, cell viability was assessed by using an Alamar Blue assay. Cell numbers were determined by generating standard curves with known numbers of untreated cells. The values are percentages of the number of treated cells compared to untreated cells. The data are represented as means of triplicate Alamar Blue assays±s.d. (C) BJ cells were treated with 0.5 U/ml of IFNβ every other day for 16 days (left panel) or 2 h (right panel), and the levels of total and tyrosine-phosphorylated proteins (PY-701-STAT1 or PY-690-STAT2) were examined by the western method. (D, E) Total RNA was extracted from BJ cells treated with 0.5 IU/ml of IFNβ every other day for 16 days. The expression of U-ISGF3-induced genes (IFI27, BST2, OAS2, MX1, IFIT1, and IFIT3) and other ISGs (MYD88, IFI16, ADAR, and IRF1) was examined by real-time PCR. The levels of gene expression were calculated semi-quantitatively by using the ΔΔCt method. The data are represented as means of triplicate PCR analyses±s.d. (F) BJ cells were infected with an shRNA targeting STAT1 (S1) or a non-targeted shRNA (NON) and the levels of STAT1 protein expression were examined by the western method. The cells were treated with doxorubicin and their viability was assessed after 72 h by using an Alamar Blue assay. Cell numbers were determined by generating standard curves with known numbers of untreated cells. The values are percentages of the numbers of treated cells compared to untreated cells. The data are represented as means of triplicate of Alamar Blue assays±s.d.
Source data for this figure is available on the online supplementary information page.

