Figure 5.
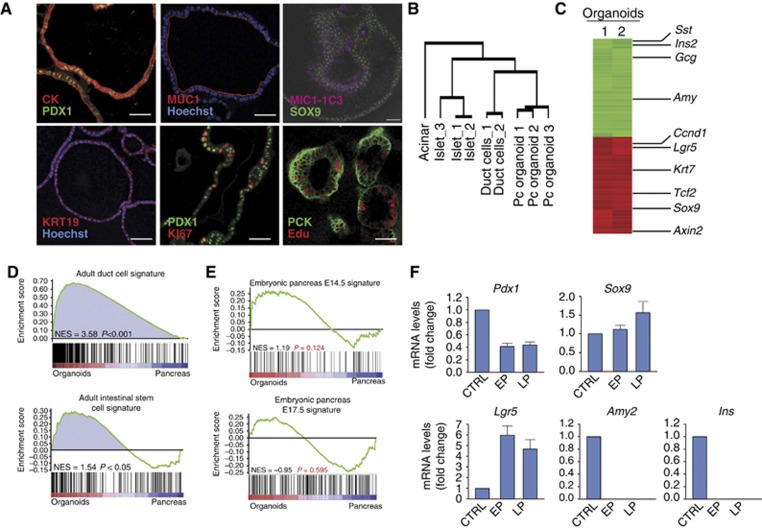
Characterization of in vitro expanded organoids from single cells. Pancreatic organoids cultured in our defined medium show a ductal-like phenotype. FACS-sorted epithelial cells were isolated as shown in Figures 3 and 4, plated in matrigel and cultured for 7–9 passages before being processed for RNA and immunohistochemistry analysis. (A) Organoids were stained with anti-pancytokeratin (CK), anti-PDX1, anti-mucin 1 (MUC1), anti-SOX9, anti-cytokeratin19 (CK19) and anti-MIC1-1C3 that revealed their duct-like phenotype. Cells were proliferating, as illustrated by anti-Ki67 and Edu immunostaining. Scale bars: 35 μm. (B) Hierarchical clustering analysis of genes differentially expressed among pancreatic organoid cultures, duct, acinar and islet pancreatic lineages. Unsupervised hierarchical clustering analysis shows that the pancreas organoid arrays cluster with the ductal array while the acinar and islet profiles clustered in a separate tree. (C) Heat map of two independent clonal pancreas organoid cultures performed after subtracting pancreas tissue expression levels. Representative organoid-, duct-, endocrine- and exocrine-specific genes are listed on the right. Red, upregulated; green, downregulated. (D, E) Gene set enrichment analysis (GSEA) revealed that pancreas organoid cultures express a significant amount of genes contained in signatures of adult duct cells and intestinal stem cells (Muñoz et al, 2012) (D), while they were not enriched in gene sets representing embryonic pancreas at E14.5 or E17.5 (Juhl et al, 2008) (E). (F) Quantitative PCR showing relative fold changes of Pdx1, Sox9, Lgr5, Amy2 and Ins mRNA levels in partial duct ligated pancreas (CTRL) and cultured organoids at early (EP, passages 2–3) and late passages (LP, passages 7–9). Cyclophillin A was used to normalize for RNA input. Data represent mean±s.e.m. (n=2, independent cultures).

