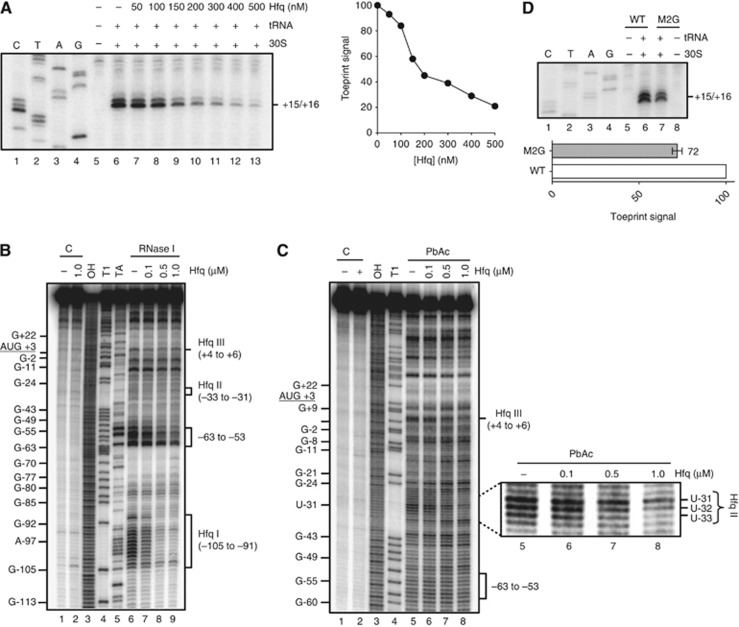
Figure 6.
Hfq represses 30S ribosomal subunit binding to cirA mRNA upon translation initiation. (A) Toeprint analysis of Hfq effect on 30S ribosomal subunit binding to cirA mRNA (200 nM) upon translation initiation. Unlabelled cirA mRNA was incubated in the presence of the indicated amounts of purified Hfq protein. Positions +15/+16 relative to cirA AUG start codon are indicated. CTAG refers to sequencing ladders. Toeprint signals were quantified by densitometry and data are reported in arbitrary units. (B) RNase I probing of Hfq binding sites on cirA mRNA. 5′-end-labelled cirA mRNA (nucleotides −173 to +78 relative to the AUG start codon) was incubated in the presence of the indicated amounts of purified Hfq protein before addition of RNase I. Hfq I, Hfq II, and Hfq III refer to Hfq binding sites I, II, and III (see Figure 2). C, non-reacted controls; OH, alkaline ladder; T1, RNase T1 ladder (guanine residues); TA, RNase TA ladder (adenine residues). (C) PbAc probing of Hfq binding sites on cirA mRNA. 5′-end-labelled cirA mRNA (nucleotides −173 to +78 relative to the AUG start codon) was incubated in the presence of the indicated amounts of purified Hfq protein before addition of PbAc (5 mM). Hfq II and Hfq III refer to Hfq binding sites II and III (see Figure 2). Some guanine and adenine positions are given for clarity. C, non-reacted controls; OH, alkaline ladder; T1, RNase T1 ladder (guanine residues). The region corresponding to Hfq binding site II (Hfq II) is enlarged to illustrate protection from PbAc cleavage of nucleotides −33 to −31 following addition of Hfq. (D) Toeprint analysis of 30S ribosomal subunit binding to cirAM2G mRNA. Unlabelled cirA and cirAM2G mRNAs (0.2 μM final) were incubated in the presence of 30S ribosomal unit and tRNAfmet. Positions +15/+16 relative to cirA and cirAM2G AUG start codons are indicated. CTAG refers to sequencing ladders. Toeprint signals of two independent experiments were quantified by densitometry and normalized to WT toeprint signal (lane 6). Data are reported in arbitrary units. Mean and standard deviation (s.d.) values of duplicate experiments are shown.
Source data for this figure is available on the online supplementary information page.

