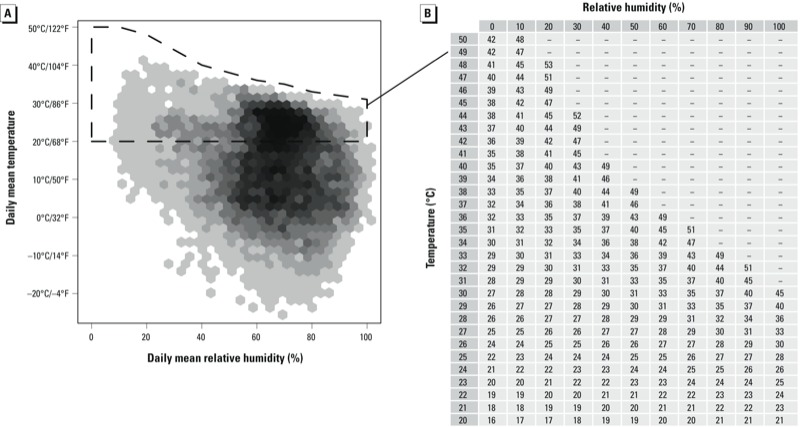
Figure 1.

Distributions of daily temperature and relative humidity in U.S. state capitals in 2011 (A) and data from Steadman’s original apparent temperature table (B) (Steadman 1979a), which has been reformatted to correspond with the weather distribution graph and gives apparent temperature values in degrees Celsius. For the distribution graph (A), darker areas indicate more days with the given weather, and white indicates no days with those weather conditions in the U.S. state capitals in 2011. Weather conditions covered by Steadman’s table for air temperature and relative humidity are indicated by the dotted line. Data from Steadman (1979a), ©American Meteorological Society, are used with permission.
