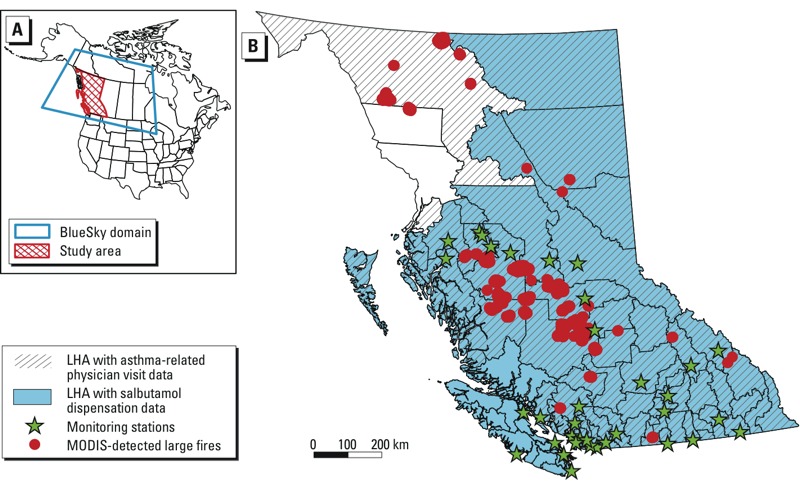
Figure 1.

Map of the BlueSky model domain (A) and study area (B) showing the local health areas (LHAs) and their health data availability, locations of the PM2.5 air quality monitoring stations, and locations of fire hot spots detected by the Moderate Resolution Imaging Spectroradiometer (MODIS) with fire radiative power (a measure of fire intensity) > 100 GW. In (B) the hatch pattern indicates LHAs with asthma-related physician visit data, and the area in blue indicates LHAs with salbutamol dispensation data.
