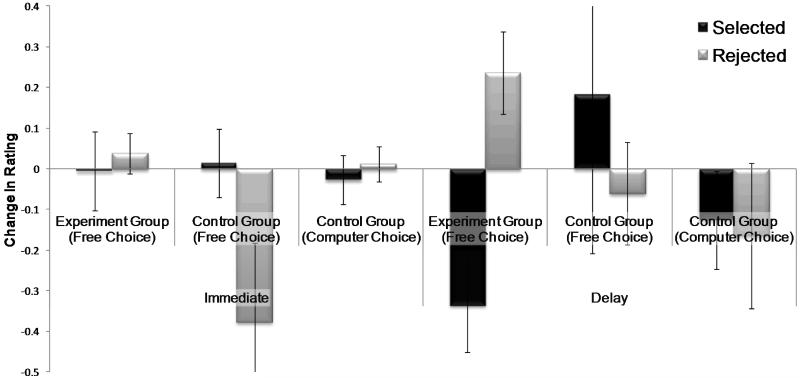
Fig. 2. Preference changes induced by making easy choices between differently rated items.
The graph shows the differences between mean-corrected prechoice ratings and mean-corrected postchoice ratings, separately for selected and rejected vacation destinations and for immediate and delayed postchoice ratings. For the experiment group, vacation destinations were divided into “selected” and “rejected” categories according to the choices participants made between the two rating sessions. For the control group, vacation destinations were divided into “selected” and “rejected” categories in two ways: according to the computer’s (random) choices which were made between the two rating sessions, and according to free choices made by participants in the free-choice task at the end of the study after the two rating sessions. *p < .05, within-subjects t test. Error bars represent standard errors of the mean.

