Figure 6.
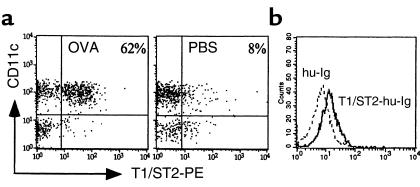
(a) T1/ST2 expression on BALF cells. Mice were immunized with OVA-DC and subsequently challenged with OVA as described in Methods. Control mice (PBS) were immunized with PBS-DC and challenged with PBS. Single-cell suspensions were surface stained with mAb’s against CD3, CD4, and T1/ST2. Dot plots were gated on CD3+ viable lymphocytes. The percentage of CD4+ lymphocytes expressing T1/ST2+ is indicated. (b) Expression of a putative ligand for T1/ST2 on mouse DCs. Bone marrow DCs were stained for CD11c, MHC class II, and T1/ST2-Ig, followed by secondary anti–hu-Ig-FITC. As a control, staining was performed using hu-Ig as primary antibody (broken line). Histogram was gated on CD11c+ MHC class II+ cells and is representative of three separate experiments.

