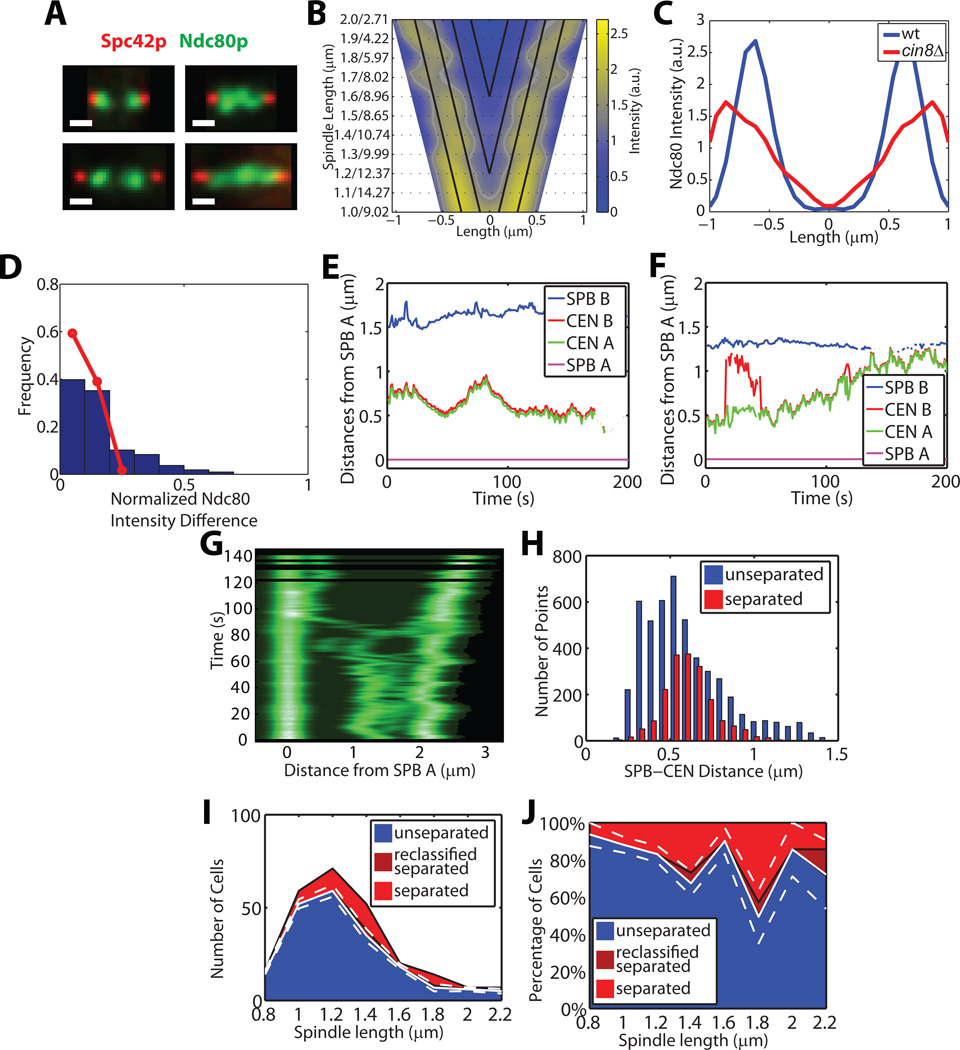
Figure 4. cin8Δ cells show symmetric kinetochore distributions and have less regulated kinetochore-microtubule lengths, leading to transient fusion of bioriented sister kinetochores.
(A) Representative intensity images (analogous to Figure 1A) of Spc42 and Ndc80 in cin8Δ cells. Scale bar 0.5 µm.
(B) Symmetrized Ndc80p distributions of n = 104 cin8Δ cells (analogous to Figure 1C for WT cells).
(C) Comparison of the WT (blue) and cin8Δ (red) Ndc80p distributions at 2 µm spindle length.
(D) Distribution of the relative intensity difference between Ndc80p bilobes (analogous to Figure 1D for WT cells). Red line, distribution in WT cells.
(E, F) Time courses of distances from SPB A to other tags (analogous to Figure 1F) for two cells with spindle midzone crossings by CEN IV tags. The example (F) shows a cell with transient separation and fusion of sister CEN IV tags, suggesting that the sisters have established biorientation but the kinetochore-microtubule length is deregulated.
(G) Kymograph aligned with respect to the position of SPB A of a cin8Δ cell entering anaphase at time ~80 s. At T = 60 s the CEN IV tags separate but both cross the spindle midzone, then fuse again and cross back on the other side (Time = 76 s), before they separate permanently.
(H) Histograms of SPB–CEN distances in cells with unseparated tags (blue) and separated tags (red) (analogous to Figure 1H for WT cells).
(I, J) Raw (I) and normalized (J) distributions of spindle lengths and their classification into spindles with unseparated (blue), separated (light red), and reclassified as separated (dark red) CEN IV tags. White solid and dashed lines indicate mean ± bootstrapped SD of cells with syntely (see Figures 1J and 1L). See also Tables S1 and S2, and Movie S7.

