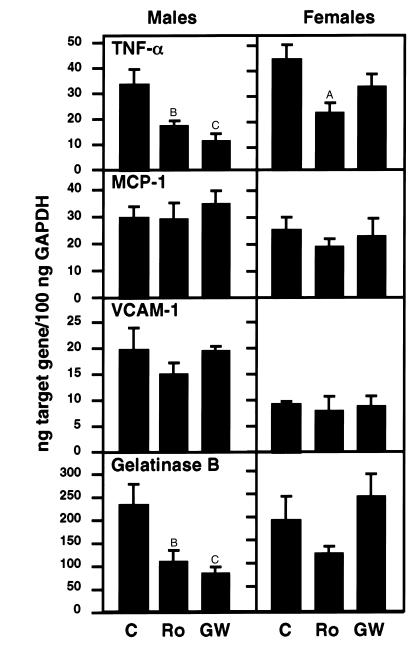
Figure 4.
Expression of TNF-α, MCP-1, VCAM-1, and gelatinase B mRNA in the aortic root. The mRNA levels were quantitated using real-time RT-PCR. Six to seven samples per group were analyzed. C, control; Ro, rosiglitazone; GW, GW7845. Data are expressed as mean ± SEM. AP < 0.05, BP < 0.01, and CP < 0.001, drug treatment groups vs. cholesterol group.

