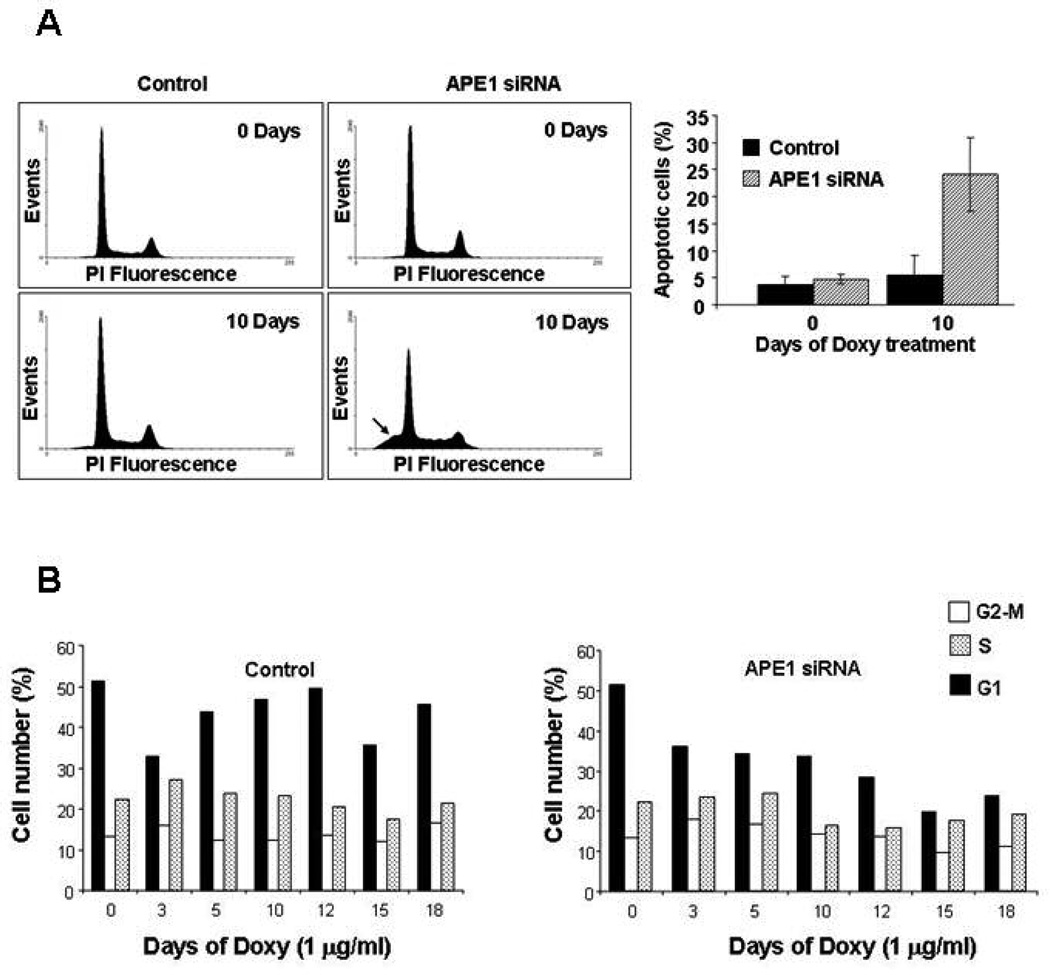
Figure 2. Impaired proliferation in APE1 silenced cells is due to altered cell cycling and induced apoptosis.
Panel A. Left, evaluation of apoptosis, on isolated nuclei, on control and on APE1 siRNA cells at 10 days of treatment with doxycycline by flow cytometry. Apoptosis is expressed as the percentage of sub-G1 DNA containing cells (indicated by arrow), as detected by propidium iodide (PI) DNA staining. Right, each bar of the histogram represents the mean of three separate experiments ± SD.
Panel B. Analysis of cell cycle distribution. Control and APE1 siRNA HeLa cells were grown in the presence of doxycycline for the indicated times. Cell cycle distribution was evaluated at the indicated time points by FACS analysis, as described in Materials and Methods. APE1 siRNA cells show a time-of-induction dependent decrease in the cycling cells population, and a parallel increase in the S-G2/M versus G1 ratio.

