Fig. 4.
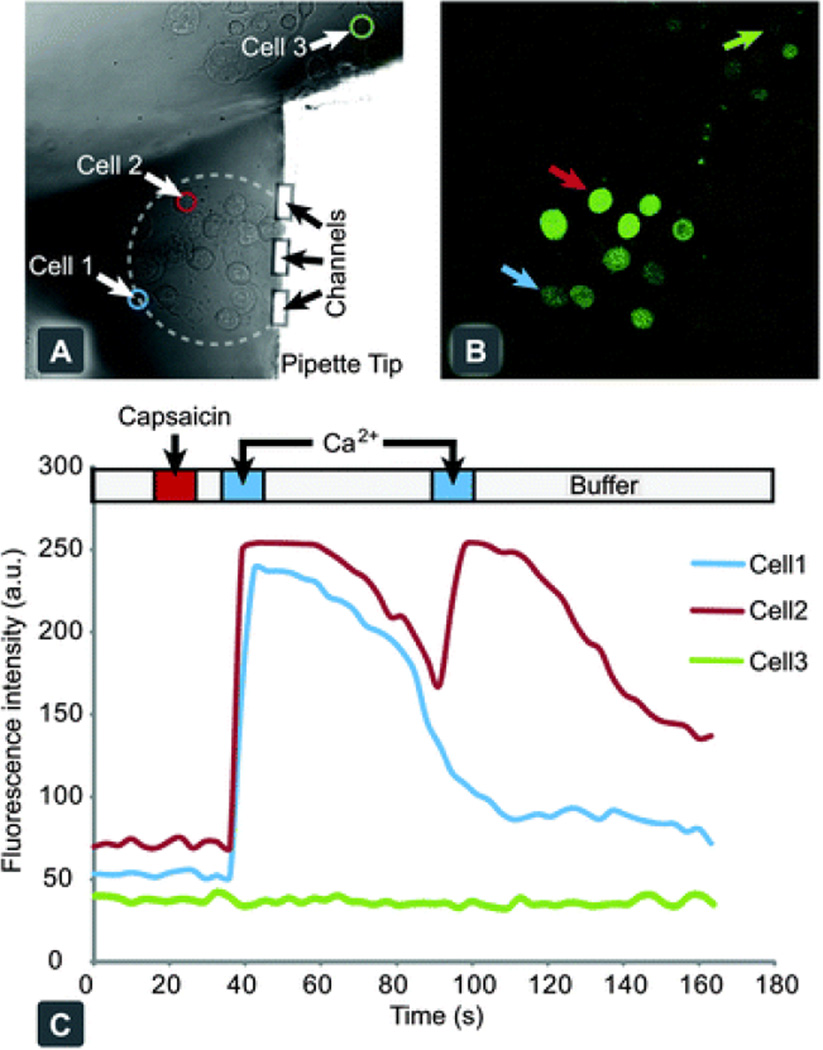
Chemical stimulation and response of individual hTRPV1 expressing CHO cells, through activation with capsaicin. (A) Bright field microscopy image of adherent cell culture of hTRPV1 expressing CHO cells, with the pipette tip targeting a small collective. (B) Confocal fluorescent micrograph of Calcium Green™ loaded cells after stimulation with capsaicin and subsequent exposure to Ringer's solution, spiked with 10 mM calcium chloride. (C) A graph of individual cellular responses to the application protocol, with the delivery times highlighted above. Cells 1 and 2 are within the recirculation zone and display a positive activation response. Cell 3 is a representative cell from the background outside of the stimulation zone.

