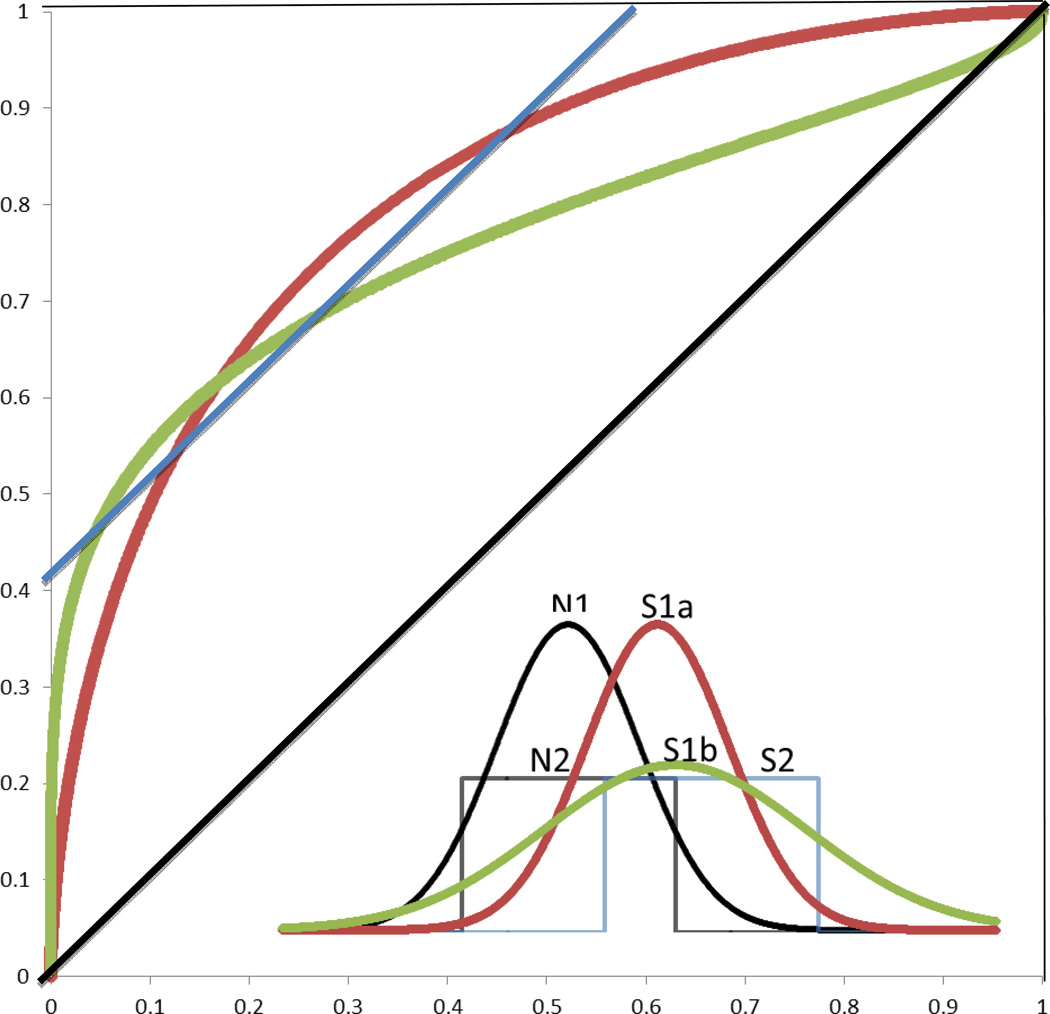
Figure 1.
Theoretical isosensitivity functions and their generating distributions. Gaussian signal and noise distributions of equal variance (N1 and S1a) yield bowed and symmetric isosensitivity functions (red curve). Gaussian signal and noise distributions of unequal variance (N1 and S1b) yield bowed and asymmetric functions (green curve). Rectangular threshold functions (N2 and S2) yield straight functions (blue line).

