Figure 7.

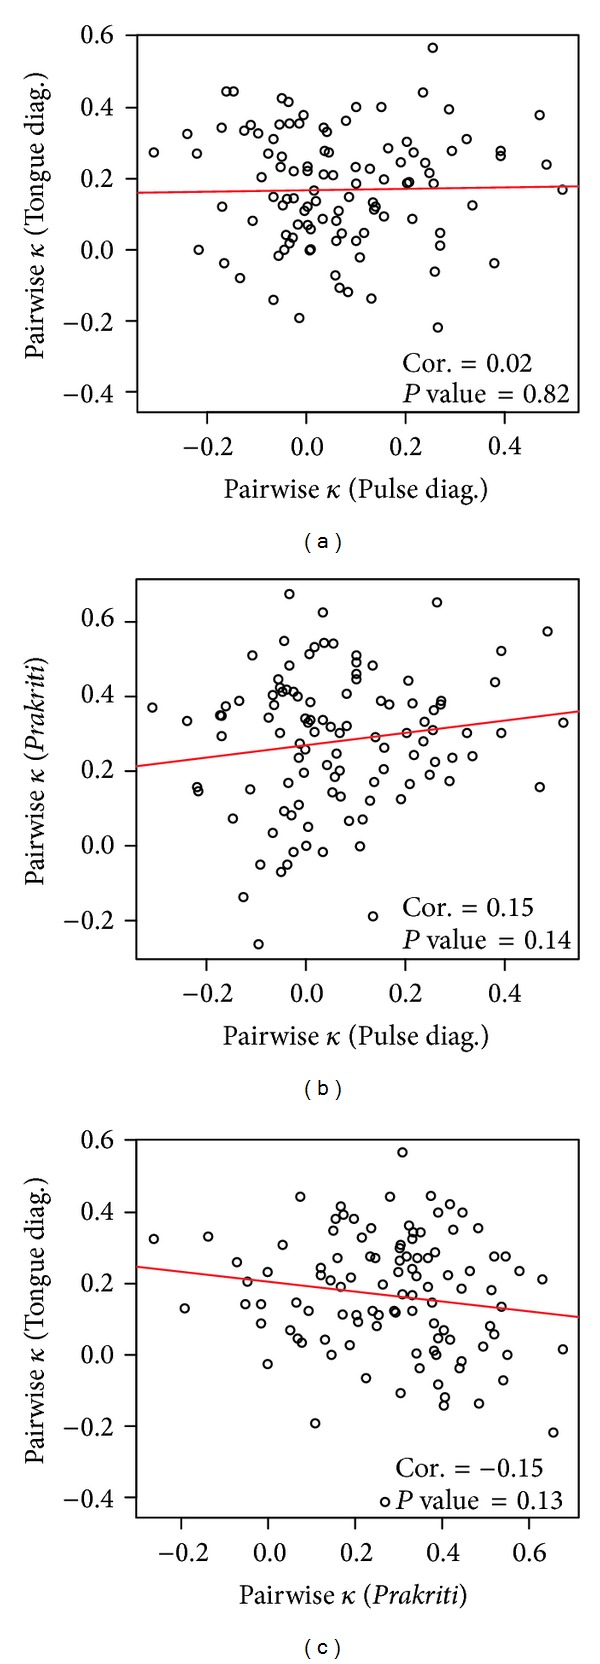
Scatter plots of the pairwise kappa values between different diagnoses. Shown in each panel are the Pearson correlation coefficient and a corresponding P value for the hypothesis of zero correlation coefficient.

Scatter plots of the pairwise kappa values between different diagnoses. Shown in each panel are the Pearson correlation coefficient and a corresponding P value for the hypothesis of zero correlation coefficient.