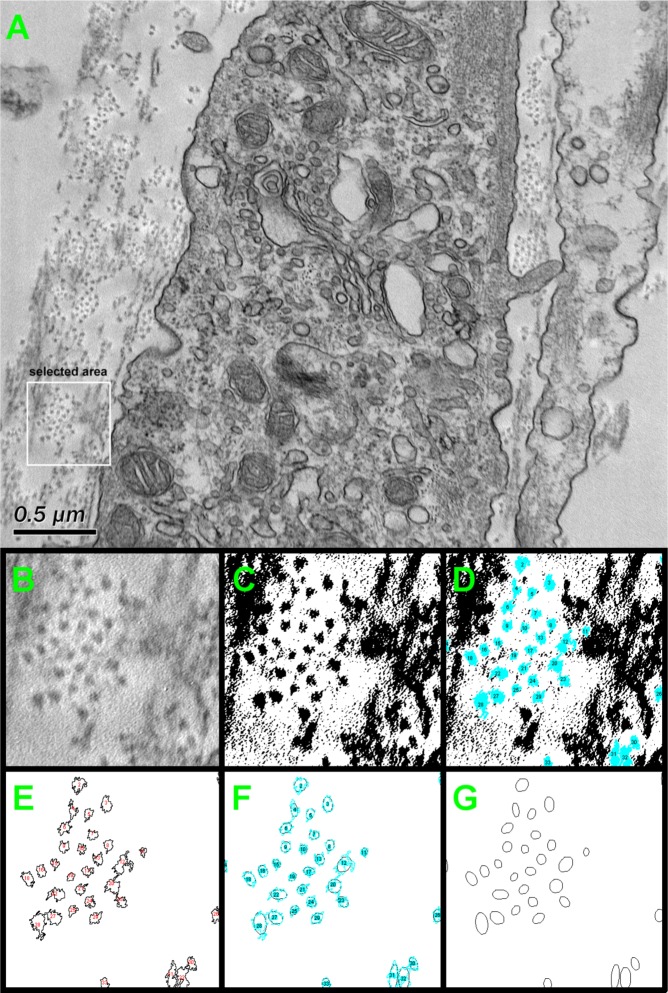
Figure 1.
Schematic representation of the method used to quantify the fibril density from TEM images with ImageJ software. (A) The original TEM image with random 0.5 μm × 0.5 μm area selected (white box); (B) selected area magnified; (C) magnified image converted to a binary black/white image; (D) collagen fibrils identified by edge detection method (blue spots); (E) outlines of each detected area; (F) fitted ellipses to detected area; and (G) final highlighted ellipses showing the collagen fibrils. The fibril density was then calculated by counting the fibrils within the selected area.

