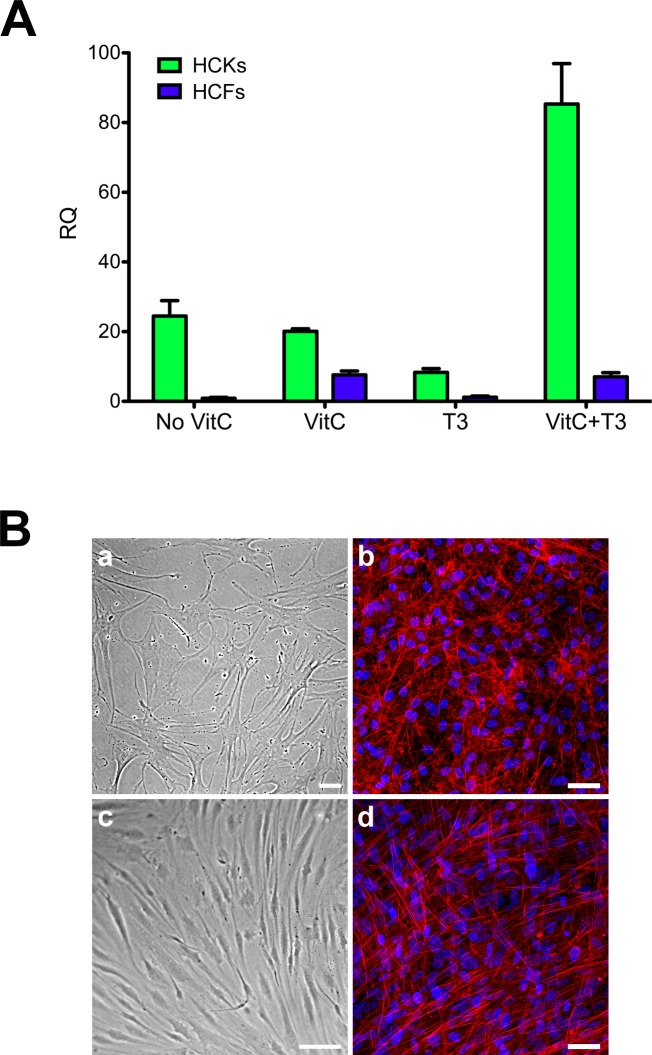
Figure 2.
(A) Quantitative reverse transcriptase PCR analysis of both HCKs and HCFs for keratocan expression. Four conditions were tested: No VitC, VitC, T3, and VitC+T3. Under all conditions HCKs expressed significantly higher levels of Keratocan when compared with HCFs (P < 0.01). (B) Representative images showing the morphology for both HCKs (a, b) and HCFs (c, d) in two-dimensional (2D) (a, c) and 3D (b, d) cultures. HCKs maintained their dendritic morphology (a, b), whereas HCFs showed a more fibroblastic, elongated morphology (c, d). Red = Phalloidin, Blue = TOPRO-3. Scale bars: 50 μm.

