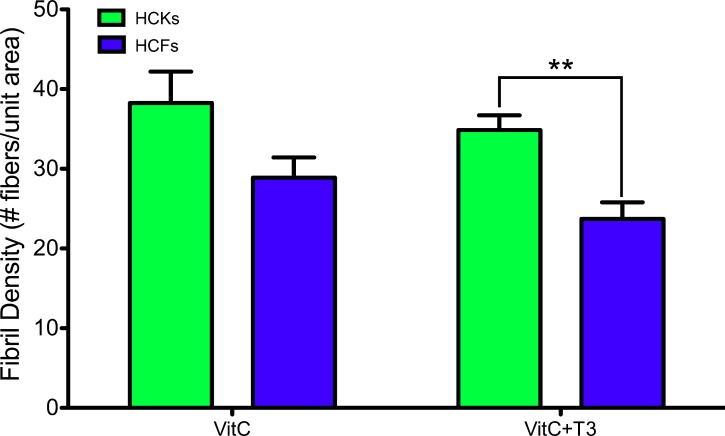
Figure 5.
Graph demonstrating the fibril densities obtained from the TEM images for HCK and HCF constructs' ±T3. HCKs showed higher density of fibrils per unit area when compared with HCFs, both ±T3, with T3 stimulation of the HCKs causing the density to become significantly greater than with the HCFs (**P < 0.01).

