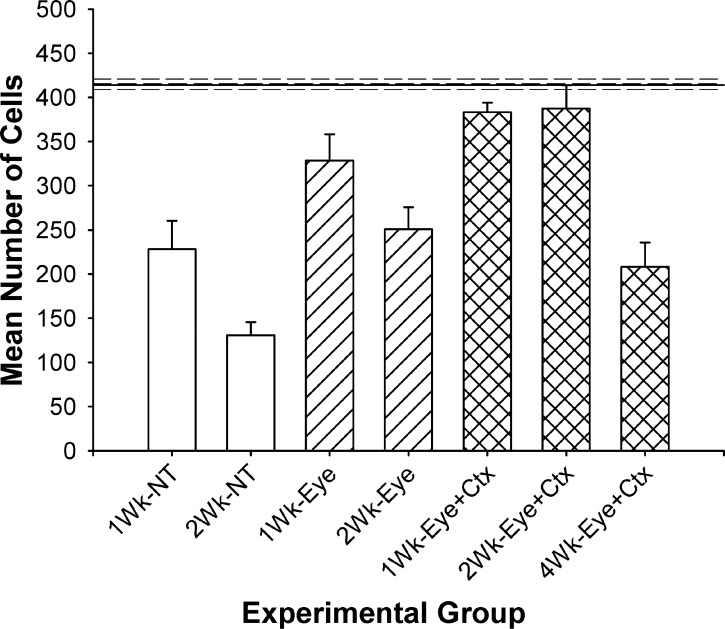
Figure 2.
Comparison of mean ganglion cell survival in the peripheral retina under each experimental condition. Solid line represents the mean number of cells measured in matched regions of the normal fellow eye. Values are mean ± SEM. NT and eye only values versus N, P < 0.001 to 0.05; NT versus eye, P < 0.05; eye versus DT, 1-week, NS; 2-week, P < 0.05; DT versus N, P > 0.05; DT versus 4-week, P < 0.05. The 1- and 2-week data are from the study of Weber et al.15

