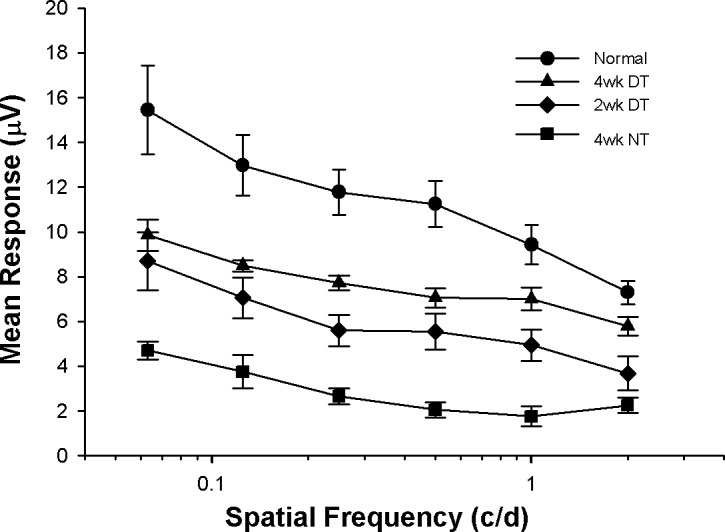
Figure 3.

Pattern ERG responses to gratings of different spatial frequency for each experimental condition. Although not normal, the responses measured in the treated animals are significantly better than those measured in animals not receiving treatment. Note also that the 4-week DT responses are consistently stronger than the 2-week DT responses. Values are mean ± SEM. N versus DT, P < 0.05; 2-week versus 4-week, P > 0.05; DT versus NT, P < 0.05.
