
Figure 7.
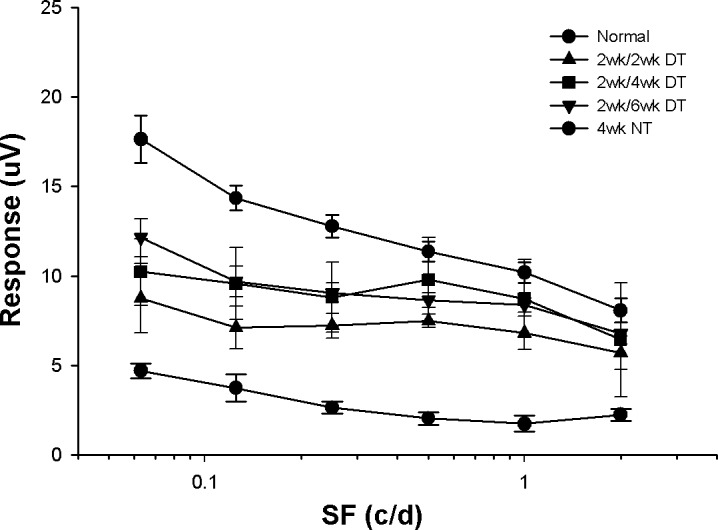
PERG responses for each of the different experimental conditions tested. All of the treated animals displayed responses that were significantly stronger than those measured in animals without treatment (P < 0.05). There was no significant difference among the treated animals, nor between the responses of the longer survival animals and normals at the higher spatial frequencies tested (P > 0.05).