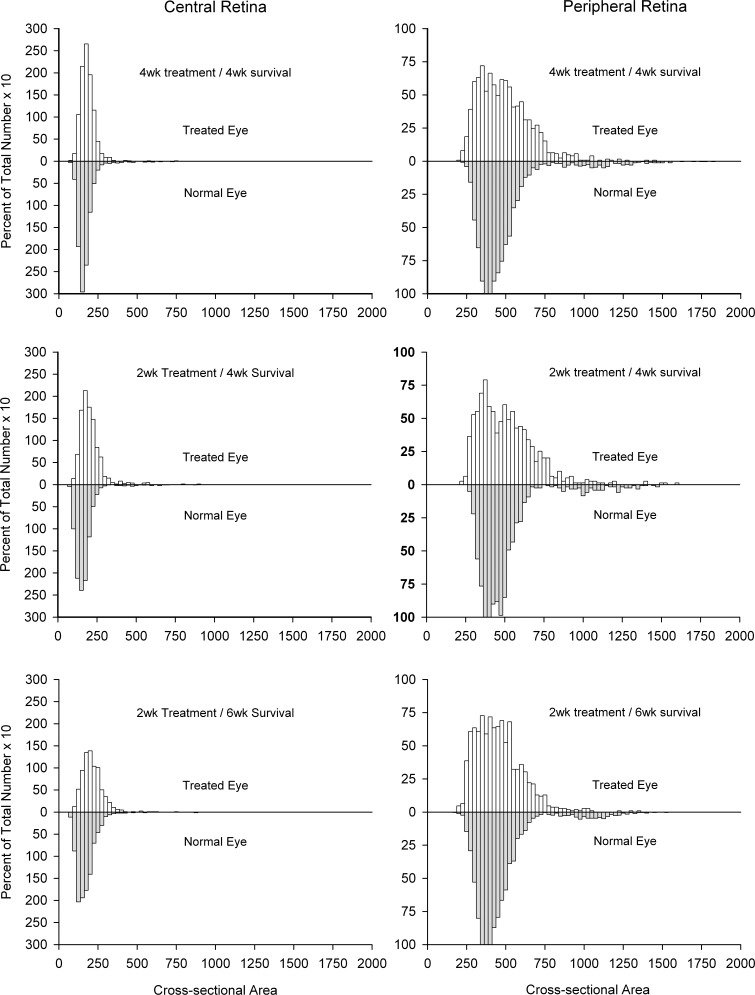
Figure 8.
Size distributions of ganglion cells in the central and peripheral retina of experimental (top) and normal (bottom) eyes as a percentage of the total number of ganglion cells in the sample region. Although not significant, there was a slight shift toward larger cell size in the treated versus normal animals.

