
Figure 6.
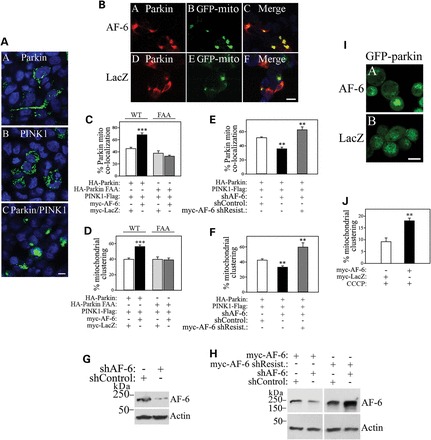
AF-6 increases mitochondrial clustering. (A) SH-SY5Y cells were transfected with GFP-mito, in the presence of myc-parkin (A), PINK1-HA (B) and myc-parkin together with PINK1-HA (C). Confocal microscopy depicts GFP-mito and DAPI fluorescence. Scale bar, 25 μm. (B) SH-SY5Y cells were transfected with GFP-mito, HA-parkin, PINK1-Flag, in the presence of either myc-AF-6 or myc-LacZ. Immunocytochemistry and confocal microscopy were carried out with anti-HA (red, A and D) and GFP-mito fluorescence (green, B and E). Scale bar, 25 μm. (C and D) Plots show the quantification of AF-6-mediated increase in parkin translocation (C) and mitochondrial clustering (D) relative to LacZ. Plots also show the inability of AF-6 to increase parkin FAA translocation (C) and mitochondrial clustering (D). SH-SY5Y cells were transfected, processed and analyzed as in (B), in the presence of HA-parkin wild-type or FAA. Error bars represent standard error of 8–12 independent experiments. ***Significantly different from LacZ control at P < 0.001. (E and F) SH-SY5Y cells were transfected with GFP-mito, HA-parkin, PINK1-Flag, with either shRNA control or shRNA to AF-6. Plots show the quantification of parkin translocation (E) and mitochondrial clustering (F) upon AF-6 knockdown. Transfection of shRNA-resistant myc-AF-6 rescued the effects of shRNA-mediated AF-6 knockdown on parkin translocation (E) and mitochondrial clustering (F) (gray bars). Error bars represent standard error of four to seven independent experiments. **Significantly different from shRNA control at P < 0.01. (G) SH-SY5Y cells were transfected with shRNA to AF-6 or shRNA control. The presence of AF-6 in total cell lysates was detected using an anti-AF-6 antibody (upper panel). Loading control was monitored with an anti-actin antibody (lower panel). (H) SH-SY5Y cells were transfected with shRNA to AF-6 or shRNA control, in the presence of myc-AF-6 or or shRNA-resistant myc-AF-6. The presence of AF-6 in total cell lysates was detected using anti-AF-6 antibody (upper panel). Loading control was monitored with an anti-actin antibody (lower panel). (I) HeLa cells stably expressing GFP-parkin were transfected with myc-AF-6 or myc-LacZ. Cells were treated with 10 μm CCCP for 1 h and analyzed by confocal microscopy to reveal GFP-parkin and its clustering at the mitochondria upon CCCP treatment. Scale bar, 25 μm. (J) The graph shows the quantification of AF-6-mediated increase in mitochondrial clustering assessed by GFP-parkin fluorescence. HeLa cells stably expressing GFP-parkin were transfected and processed as in I. Error bars represent standard error of three independent experiments. **Significantly different from control at P < 0.01.