
Figure 9.
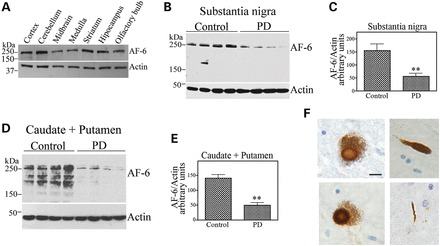
AF-6 is decreased in PD patients and aggregates into Lewy bodies. (A) Homogenates prepared from different rat brain regions were probed with an anti-AF-6 antibody (upper panel). Loading control was monitored with an anti-actin antibody (lower panel). (B) Homogenates prepared from control and PD substantia nigra tissues were probed with an anti-AF-6 antibody (upper panel). Loading control was monitored with an anti-actin antibody (lower panel). (C) The graph represents the average of AF-6 levels in the substantia nigra shown in (B). Levels of proteins were determined by ImageMaster analysis and AF-6 were normalized relative to actin. Error bars represent standard error of four different patients. **Significantly different from control at P < 0.01. (D) Homogenates prepared from control and PD caudate and putamen tissues were probed with an anti-AF-6 antibody (upper panel). Loading control was monitored with an anti-actin antibody (lower panel). (E) The Graph represents the average of AF-6 levels in the caudate and putamen shown in (D). Levels of proteins were determined by ImageMaster analysis and AF-6 were normalized relative to actin. Error bars represent standard error of four different patients. **Significantly different from control at P < 0.01. (F) Immunohistochemistry analysis of midbrain sections incubated with a purified anti-AF-6 antibody. Lewy bodies containing AF-6 are shown in sections from two distinct PD cases (left panels). Right panels show the presence of AF-6 in Lewy neurites. Scale bar is 20 μm.