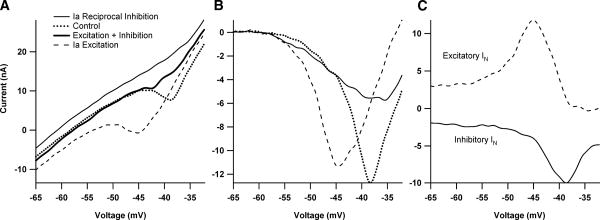
Fig. 1.
The relationship between excitatory and inhibitory synaptic input and the current-voltage (I–V) function. A: the effect of excitatory and inhibitory synaptic input applied separately and simultaneously on the shape of the persistent inward current (PIC) during a voltage ramp for one cell in the monoaminergic intact condition. All inputs were applied steadily through the duration of the I–V function. In the absence of additional synaptic input, the PIC appears as a downward deflection in the current profile during a voltage ramp (dotted line). Synaptic inhibition, via Ia reciprocal inhibition, causes a reduction in amplitude of the PIC (top thin black trace). In contrast, Ia excitatory synaptic input results in a relatively hyperpolarized PIC activation (dashed trace.) B: I–V functions from A with leak currents subtracted. The different interactions between inhibition and excitation with the PIC are evident. C: comparison of effective synaptic current (IN) generated during excitatory and inhibitory synaptic input (same cell as A). IN was calculated by subtracting I–V traces made during the application of synaptic input with traces generated during trials with no additional synaptic input (control ramps). The dashed trace shows the excitatory Ia IN, which is enhanced >2-fold (compared with more hyperpolarized regions) and then decreases at more depolarized levels. The bottom solid black trace illustrates the inhibitory IN, which also shows amplification, but is a result of the PIC deactivation by the Ia reciprocal inhibition. Note that peak excitatory IN occurs at a more hyperpolarized voltage than the peak inhibitory IN.

