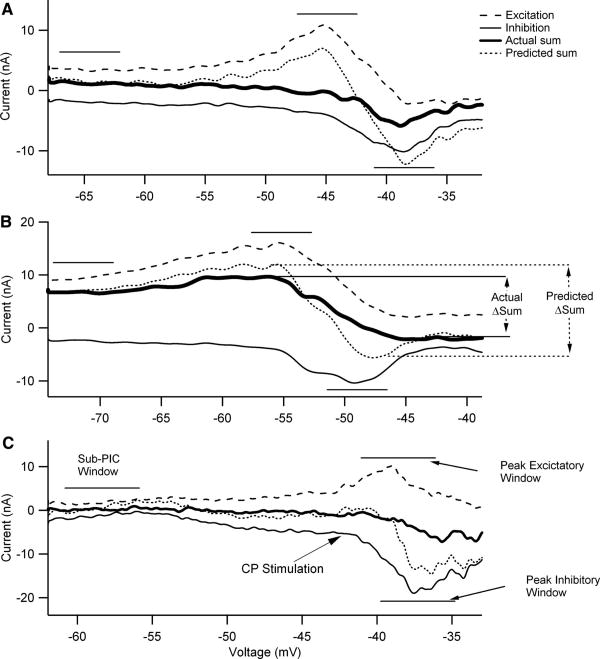
Fig. 2.
The difference in voltage onset and amplitude of peak excitatory and inhibitory IN shapes the pattern of summation. Each cell illustrated here received excitatory (dashed black trace) and inhibitory (thin black trace) synaptic inputs applied separately and simultaneously (thick black trace). The IN was calculated by subtracting stimulation trials from control trials and represents the net current measured at the soma resulting from synaptic input. In each panel, the dashed trace is the excitatory IN, the thin solid trace is the inhibitory IN, the dotted trace is the predicted sum of these two individual currents by linear addition, and the thick trace is the actual sum generated by simultaneous stimulation of excitation and inhibition. The horizontal lines indicate the voltage windows in which summation was assessed in each cell (see C for names of these windows used in the text). A: data for the same cell as illustrated in Fig. 1. The horizontal lines indicate the 5-mV voltage windows in which we compared the measured summation of excitatory and inhibitory IN currents and the predicted linear summation of these synaptic inputs (sub-PIC threshold, peak excitatory IN, and peak inhibitory IN). B: a cell with an especially large PIC. As a result, both inhibitory and excitatory currents are unusually large at the hyperpolarized levels in this cell. The variable ΔSum is defined as the IN difference between the peak excitatory IN voltage window and peak inhibitory IN voltage window. The ΔSum was calculated for both the actual summation trace (actual ΔSum) and the predicted linear summation trace (predicted ΔSum). C: a cell in which electrical stimulation of the common peroneal (CP) nerve was used to generate inhibition instead of Ia reciprocal inhibition for the cells in B and C. Note the names for the voltage windows.

