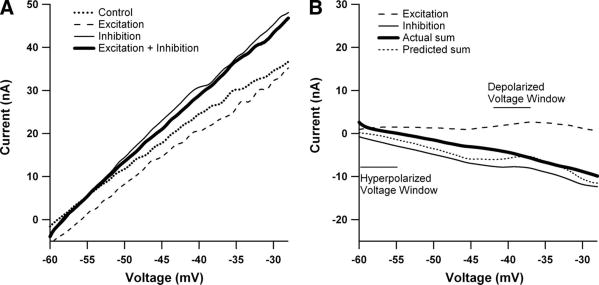
Fig. 5.
The minimal monoaminergic state results in linear I–V functions. A: current-voltage plots for one cell during control (dotted line), excitation (dashed lines), inhibition (thin black line), and excitation + inhibition (thick black line). Note the absence of any PICs (which would manifest as a negative slope region) even during the excitation trial (compare with Fig. 1A). Inhibition was applied via CP nerve stimulation and excitation by tendon vibration. B: due to the lack of PICs, the I–V relationship of the IN currents also reveals a very linear relationship (same cell as A). Further evidence of decreased PIC activity is that excitation remained relatively small across voltage ranges and on average was not significantly different from the average amplitude of excitatory IN measured in the medium state's sub-PIC voltage region (P > 0.2).

