
Figure 8.
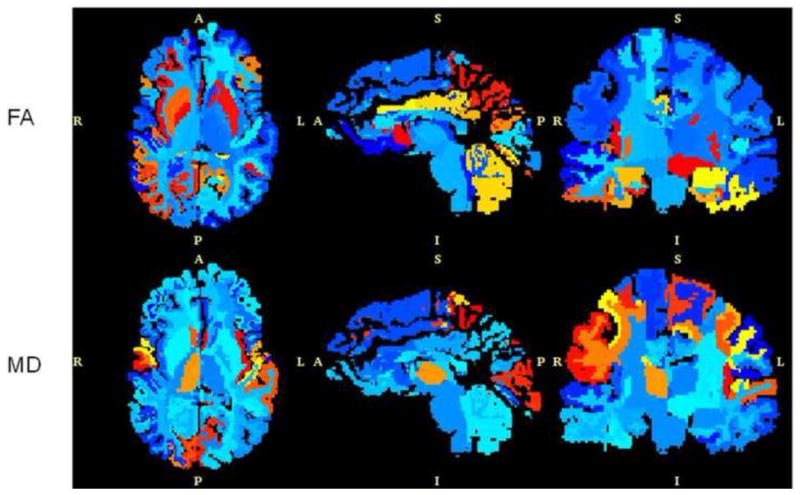
Z-score maps for a patient with chronic mTBI subject. Z-score maps were created from a comparison to a normative atlas. The regions in red and yellow show statistically significant abnormal regions for either FA (top) or MD (bottom).
Official websites use .gov
A
.gov website belongs to an official
government organization in the United States.
Secure .gov websites use HTTPS
A lock (
) or https:// means you've safely
connected to the .gov website. Share sensitive
information only on official, secure websites.
Z-score maps for a patient with chronic mTBI subject. Z-score maps were created from a comparison to a normative atlas. The regions in red and yellow show statistically significant abnormal regions for either FA (top) or MD (bottom).