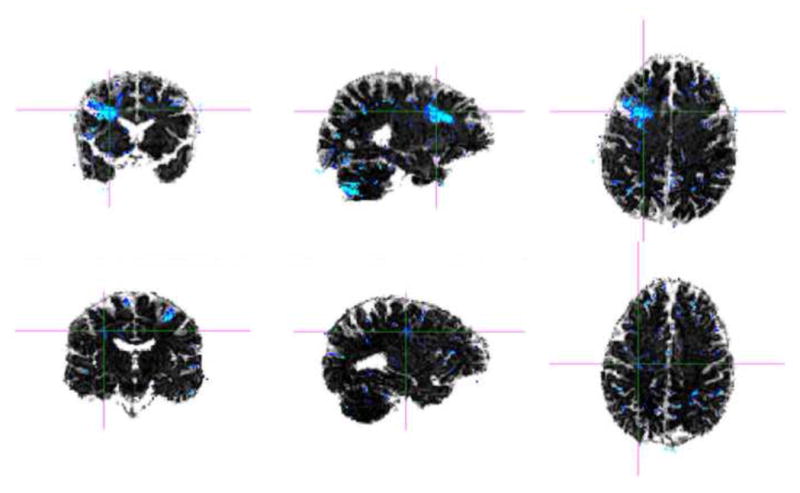
Figure 9.

Z-score maps for two patients with chronic mTBI. Z-score maps were created from a comparison to a normative atlas. The images at the top show a patient with more localized regions of increased free-water while the images at the bottom show a patient with more diffuse regions of increased free-water (blue color indicates statistically significant areas of free-water compared with the normative atlas).
