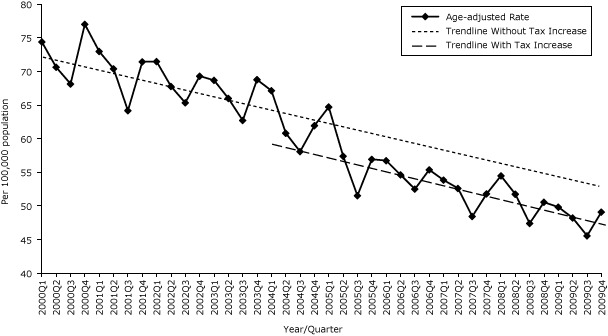
Figure 1b.
Quarterly age-adjusted AMI hospitalization rates, Pennsylvania, 2000–2009. Source: 2000–2009 Pennsylvania Health Care Cost Containment Council (PHC4) hospital discharge database.
| Year/Quarter | All |
|---|---|
| 2000 Q1 | 74.39 |
| 2000 Q2 | 70.62 |
| 2000 Q3 | 68.14 |
| 2000 Q4 | 77.00 |
| 2001 Q1 | 72.97 |
| 2001 Q2 | 70.39 |
| 2001 Q3 | 64.18 |
| 2001 Q4 | 71.42 |
| 2002 Q1 | 71.47 |
| 2002 Q2 | 67.77 |
| 2002 Q3 | 65.34 |
| 2002 Q4 | 69.31 |
| 2003 Q1 | 68.69 |
| 2003 Q2 | 66.00 |
| 2003 Q3 | 62.72 |
| 2003 Q4 | 68.78 |
| 2004 Q1 | 67.14 |
| 2004 Q2 | 60.81 |
| 2004 Q3 | 58.09 |
| 2004 Q4 | 61.95 |
| 2005 Q1 | 64.72 |
| 2005 Q2 | 57.40 |
| 2005 Q3 | 51.52 |
| 2005 Q4 | 56.93 |
| 2006 Q1 | 56.73 |
| 2006 Q2 | 54.63 |
| 2006 Q3 | 52.52 |
| 2006 Q4 | 55.38 |
| 2007 Q1 | 53.85 |
| 2007 Q2 | 52.62 |
| 2007 Q3 | 48.45 |
| 2007 Q4 | 51.81 |
| 2008 Q1 | 54.48 |
| 2008Q2 | 51.75 |
| 2008 Q3 | 47.40 |
| 2008 Q4 | 50.56 |
| 2009 Q1 | 49.83 |
| 2009 Q2 | 48.21 |
| 2009 Q3 | 45.56 |
| 2009 Q4 | 49.10 |