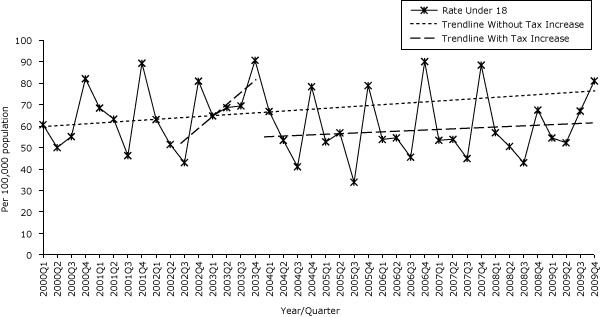
Figure 1c.
Quarterly age-specific asthma hospitalization rates for children under age 18, Pennsylvania, 2000–2009. Source: 2000–2009 Pennsylvania Health Care Cost Containment Council (PHC4) hospital discharge database.
| Year/Quarter | Under 18 y |
|---|---|
| 2000 Q1 | 60.62 |
| 2000 Q2 | 49.96 |
| 2000 Q3 | 55.10 |
| 2000 Q4 | 82.03 |
| 2001 Q1 | 68.37 |
| 2001 Q2 | 63.23 |
| 2001 Q3 | 46.24 |
| 2001 Q4 | 89.25 |
| 2002 Q1 | 63.02 |
| 2002 Q2 | 51.42 |
| 2002 Q3 | 42.97 |
| 2002 Q4 | 80.89 |
| 2003 Q1 | 64.70 |
| 2003 Q2 | 68.60 |
| 2003 Q3 | 69.37 |
| 2003 Q4 | 90.61 |
| 2004 Q1 | 66.78 |
| 2004 Q2 | 53.35 |
| 2004 Q3 | 41.04 |
| 2004 Q4 | 78.33 |
| 2005 Q1 | 52.65 |
| 2005 Q2 | 56.83 |
| 2005 Q3 | 33.85 |
| 2005 Q4 | 78.83 |
| 2006 Q1 | 53.74 |
| 2006 Q2 | 54.52 |
| 2006 Q3 | 45.51 |
| 2006 Q4 | 90.00 |
| 2007 Q1 | 53.39 |
| 2007 Q2 | 53.81 |
| 2007 Q3 | 44.87 |
| 2007 Q4 | 88.38 |
| 2008 Q1 | 56.91 |
| 2008 Q2 | 50.50 |
| 2008 Q3 | 42.89 |
| 2008 Q4 | 67.46 |
| 2009 Q1 | 54.45 |
| 2009 Q2 | 52.21 |
| 2009 Q3 | 66.99 |
| 2009 Q4 | 81.01 |