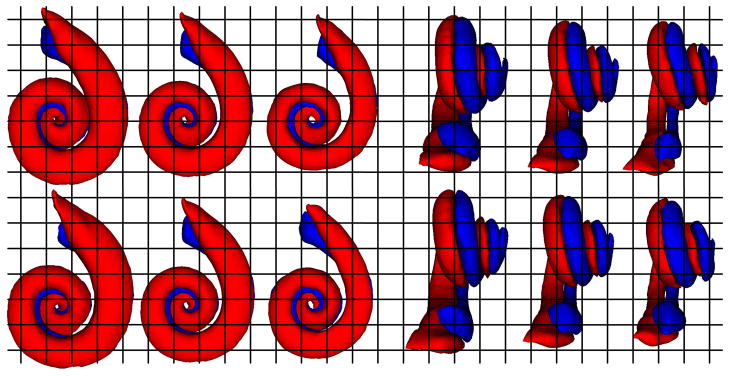
Figure 5.

First (top row) and second (bottom row) modes of variation of the scala tympani (red) and vestibuli (blue) in the point distribution model. On the left are (from left to right) −2, 0, and +2 standard deviations from the mean in Posterior-to-Anterior view. The same modes are shown on the right in Medial-to-Lateral view.
