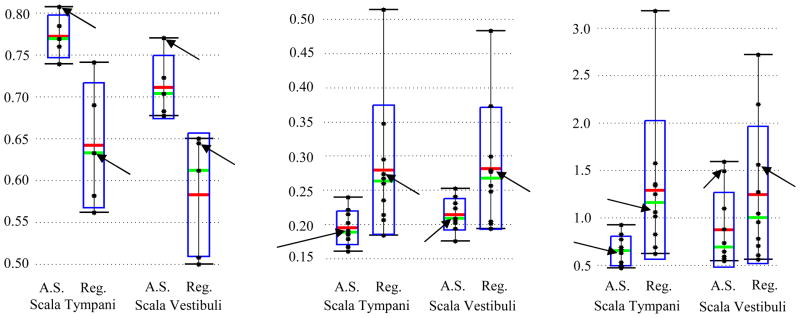
Figure 6.
Quantitative segmentation results. Shown are the distributions of the DSC (left), mean surface distance in mm (middle), and max surface distance in mm (right) for the results of the active shape model (A.S.) and registration alone (Reg.). Arrows indicate the results for the experiment shown in Figure 7.

