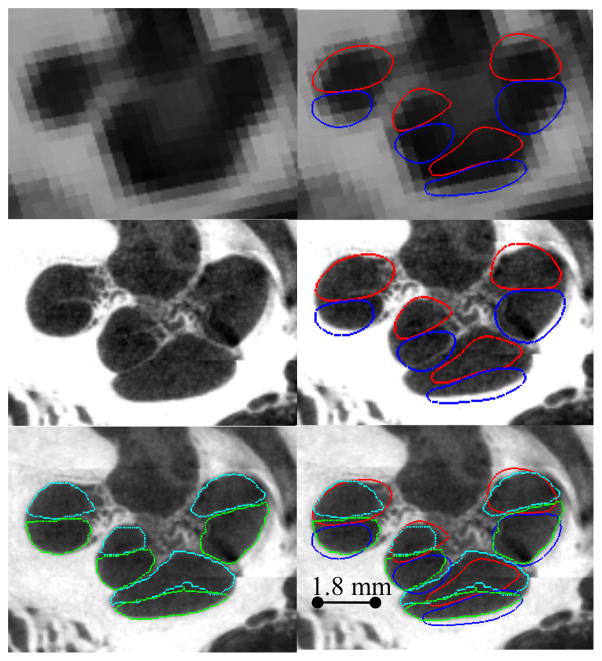
Figure 7.
Contours of representative segmentation results. Automatic segmentation results for the scala tympani (red) and scala vestibuli (blue) are shown overlaid with the conventional CT (top row), and registered μCT (middle and bottom rows), and are compared to manually delineated contours of the scala tympani (light blue) and scala vestibuli (green).

