
Figure 2.
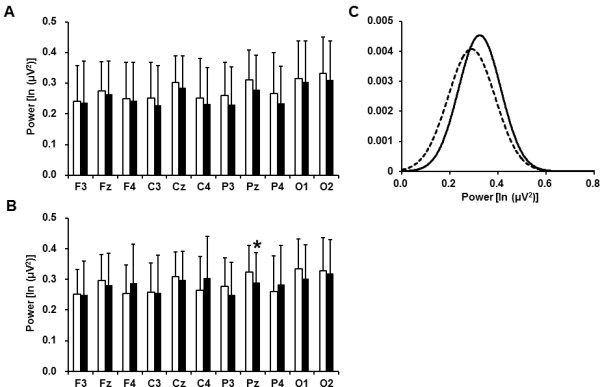
Electroencephalographic beta power densities before (open columns) and after (closed columns) 2- (A) and 0-back (B) test sessions and Gaussian distributions of the power densities on the Pz electrode before (solid line) and after (dotted line) 2-back test session (C). Data are presented as mean and SD. aP < 0.05, significantly different from the corresponding values before the fatigue-inducing sessions (paired t-test).