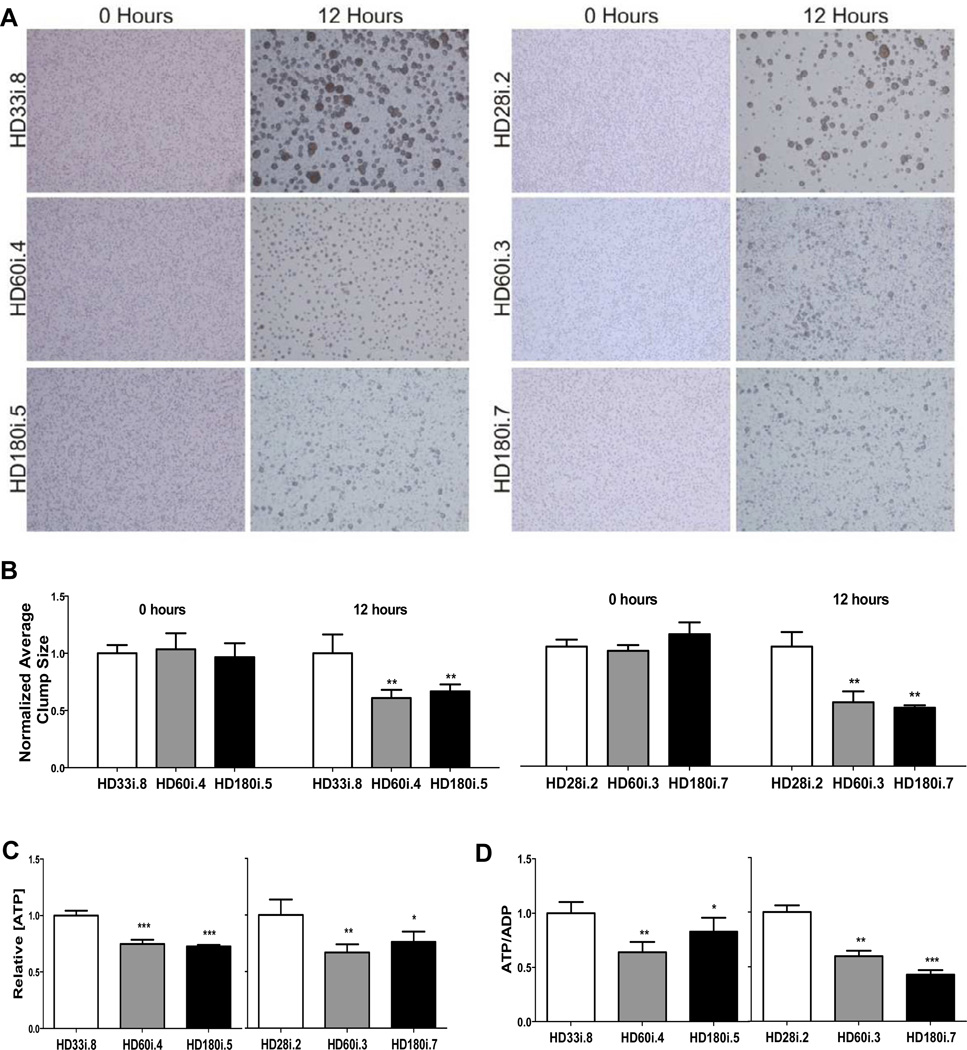
Figure 2. NPCs with Expanded CAG Alleles Exhibit Altered Energetic and Cell-Cell Adhesion.
(A) Representative micrographs demonstrating similar dispersion of NPCs at time 0, for all genotypes, and cell-cell clusters formed at 12 hours, which were larger with shorter CAG alleles, compared to NPCs with longer CAG alleles. (B) Quantitative analysis of average NPC cluster size at time 0 and 12 hours, showing a significant difference at the 12 hour time point between the shorter CAG (HD33i.8 and HD28i.2) versus the longer CAG (HD60i.4, HD60i.3, HD180i.5 and HD180i.7) alleles, consistent with decreased cell adhesion. (C) The relative intracellular [ATP] values were decreased in NPCs with longer CAG alleles (HD60i.4, HD60i.3, HD180i.5 and HD180i.7) compared to those with shorter CAG alleles (HD33i.8 and HD28i.2). (D) The relative intracellular [ATP/ADP] ratio for the longer CAG alleles (HD60i.3, HD60i.4, HD180i.5 and HD180i.7) was significantly decreased compared to NPCs with shorter CAG alleles (HD33i.8 and HD28i.2). All graphs show plotted cell values normalized to the low CAG allele controls. Error bars indicate S.D., p values are indicated as less than * 0.05, ** 0.01 and *** 0.001.

