
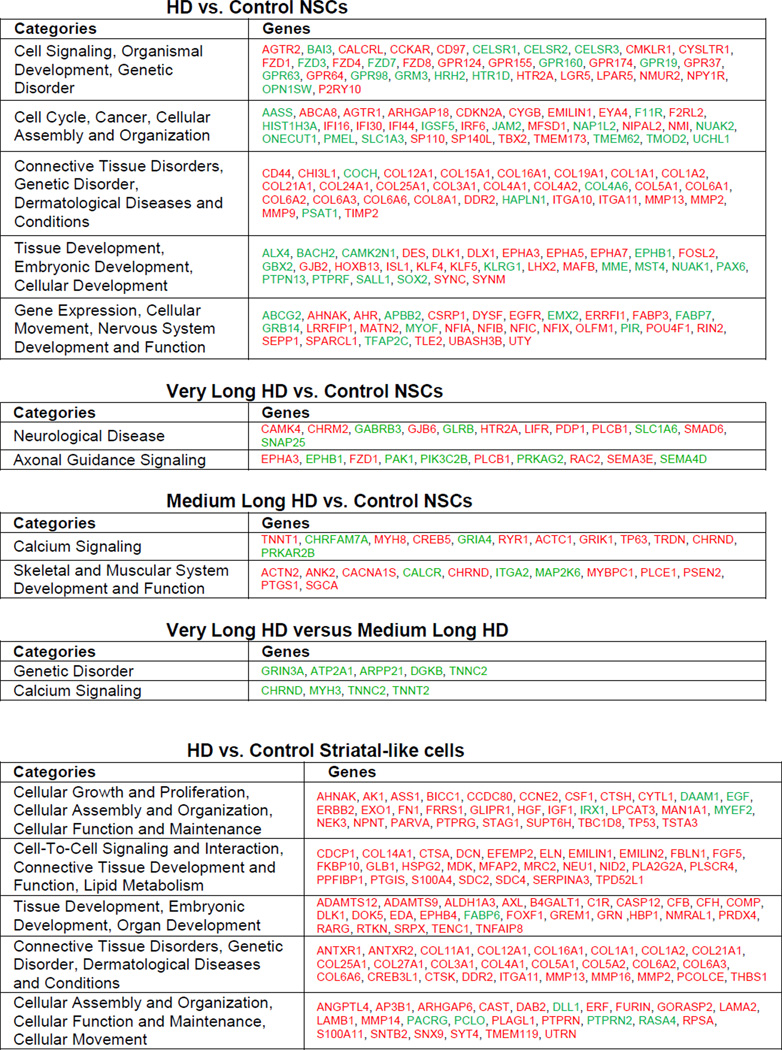
Table 1. Categorization of significantly differentially expressed genes by Ingenuity IPA.
HD vs. control NSC samples or HD vs. control striatal-like samples were analyzed and organized by IPA into networks. Categories from these networks are shown. Red represents a significant increase and green represents a significant decrease in expression of gene. Only the most highly ranked categories were selected. The top table shows the top ranked categories for all 1601 differentially expressed genes in HD versus control NSCs. Three sub-tables are shown below corresponding to various subsets of the HD NSC lines versus all Control NSC lines. Very long HD versus controls are representative genes from top two categories that change only in the HD180 and HD109 lines compared to controls but not in HD60. Medium long versus control are representative genes from top two categories that change only in HD60 compared to control. The final sub-table labeled Differentially expressed Very Long HD versus Medium Long HD are genes from an analysis of HD180 and HD109 versus HD60 intersected with All HD versus Control NSCs. This corresponds to the subtle differences that can be seen in the Hierarchical-Clustering/Heat-Map between these lines (Figure 1l). The bottom table shows the top five IPA categories for differentially expressed HD vs. Control Striatal-like cells.
 |