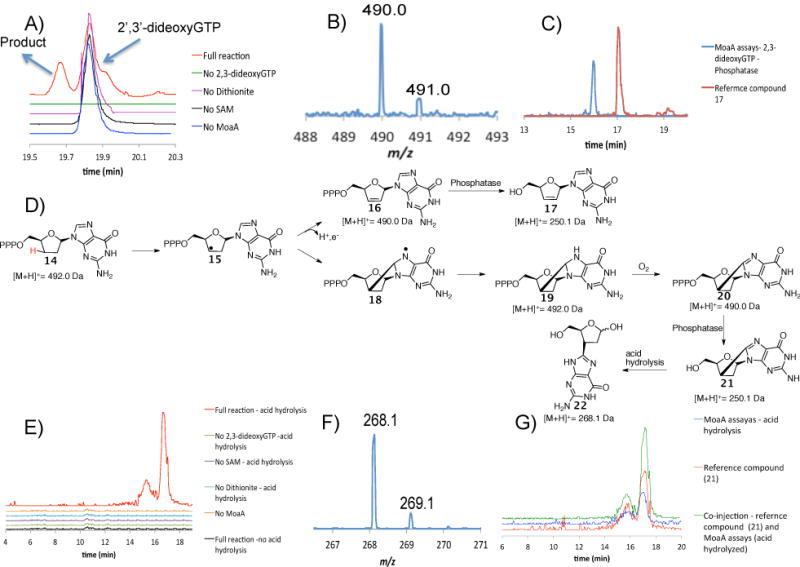
Figure 3.

Analysis of the product formed when 2′,3′-dideoxyGTP 14 is treated with MoaA. A) LC analysis of the MoaA reaction mixture and controls. Red trace is the full reaction where all the components are present. Green, pink, black and blue traces are for reaction mixtures where either 2′,3′-dideoxyGTP, dithionite, SAM or MoaA is absent respectively. The unidentified signal at 19.9 min has the same [M+H]+ as 2′,3′-dideoxyGTP. B) MS of the compound eluting at 19.6 min. The [M+H]+ is 490.0 Da -two Da less than the [M+H]+ of the substrate 14. C) Extracted Ion Chromatograms for [M+H]+ = 250.0 Da demonstrate that compound 17 is different from the dephosphorylated enzymatic product. D) Mechanistic analysis to suggest possible products formed from 2′,3′-dideoxyGTP 14. E) Extracted Ion Chromatograms for [M+H]+ = 268.1 Da demonstrate that the [M+H]+ = 268.1 Da signal is seen only in reaction mixtures with all the components present after phosphatase treatment and acid hydrolysis. The two compounds with [M+H]+ = 268.1 Da are most likely a consequence of hemiacetal isomerization during the acid hydrolysis. F) MS of the compound formed by acid hydrolysis of the dephosphorylated enzymatic product ([M+H]+ = 268.1 Da). G) Extracted Ion Chromatograms for [M+H]+ = 268.1 Da demonstrate that the derivatized enzymatic product has the same mass and co-elutes with compound 22.
