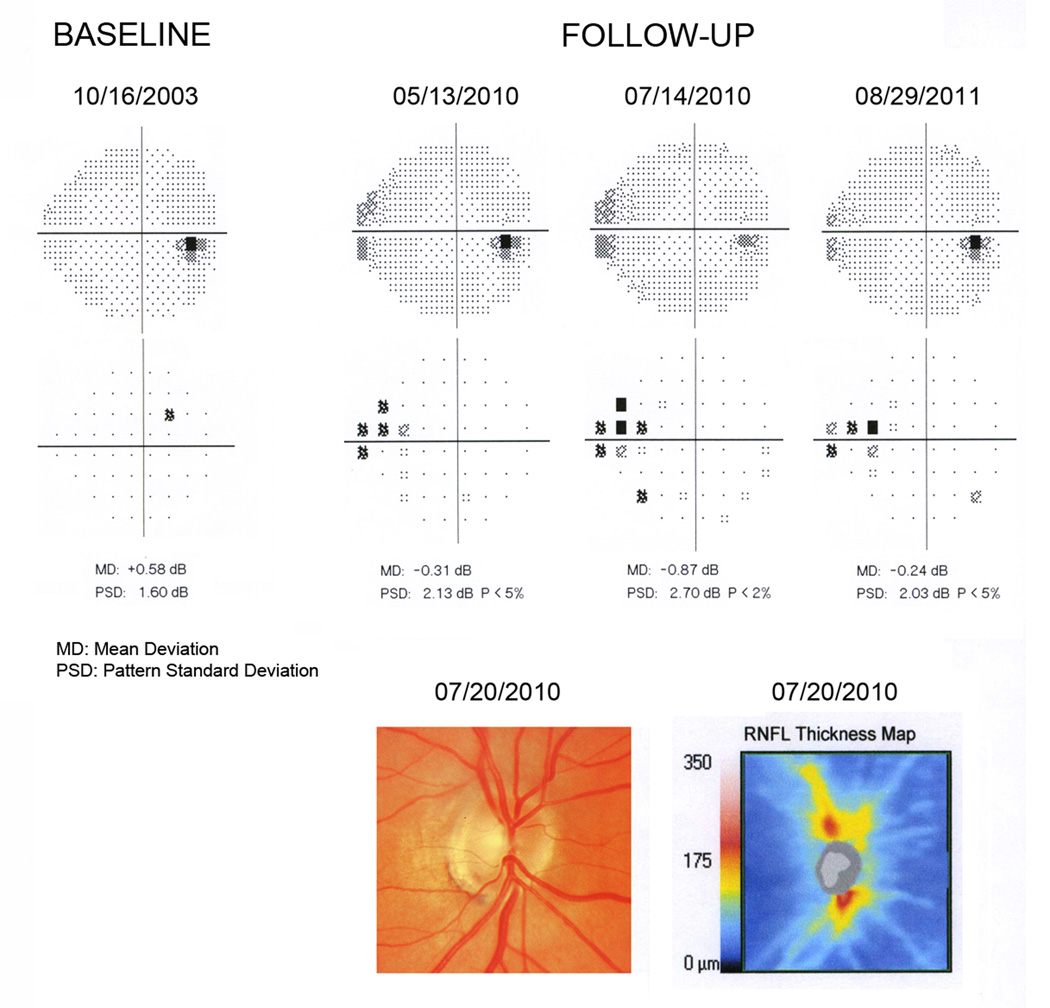
Figure 5.
Grayscale and pattern deviation plots for the visual fields for one of the glaucomatous eyes in the study. The normal baseline visual field is shown along with the 3 consecutive abnormal visual fields during follow-up. The remaining normal visual fields between baseline and first abnormal field were omitted. Estimates of retinal ganglion cell (RGC) counts were calculated using data from the first abnormal visual field (5/13/2010) and from the spectral domain optical coherence tomography (07/20/2010). The eye had an estimated RGC count of 800369 at the time of development of the initial visual field defect, which corresponded to 12% RGC loss compared to the healthy group. The optic disc photograph shows inferior neuroretinal rim thinning in agreement with inferior retinal nerve fiber layer (RNFL) loss detected by spectral domain optical coherence tomography.

