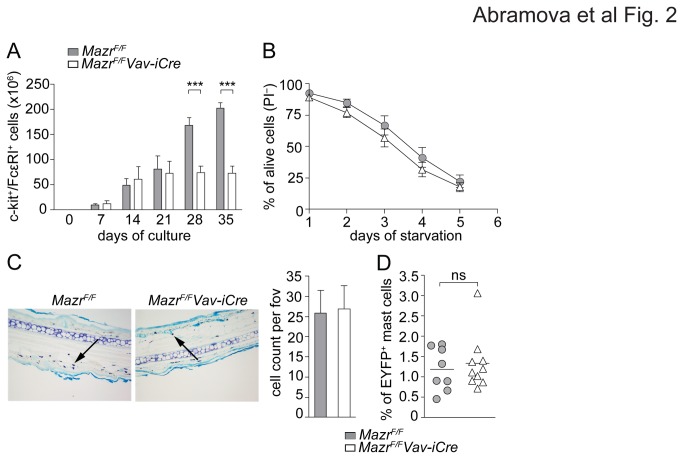
Figure 2. Reduced mast cell numbers in vitro but normal mast cell homeostasis in vivo.
(A) Diagram showing the cumulative numbers of c-kit+FcεRI+ Mazr F/F and Mazr F/F Vav-iCre BMMC over the course of 5 weeks of culture. Cells were counted by CASY counter, then percentages of c-kit+FcεRI+ BMMC among PI-negative cells (= alive) was determined by flow cytometry. The summary of three independent experiments with a total of 6 independent cell batches is shown. Mean ± SEM is shown.
(B) Number of PI-negative (= alive) Mazr F/F and Mazr F/F Vav-iCre BMMC during 5 days of IL-3 starvation. The summary of 3 experiments is shown. Mean ± SEM is shown.
(C) Toluidine blue staining of paraffin-embedded 5 µm ear sections of Mazr F/F and Mazr F/F Vav-iCre mice showing mast cells in pink/purple color (examples indicated by arrowheads). Diagram at the right indicates mean ± SEM of mast cell number per field of view (fov) calculated over 10 individual sections per ear (n=4). Magnification 20x.
(D) Percentage of EYFP+c-kit+FcεRI+ mast cells from peritoneal lavage of wild-type (MazrF/+Rosa26+/EYFPMcpt5Cre) and mast cell-specific MAZR-null (MazrF/FRosa26+/EYFPMcpt5Cre) mice (n=8 and 9, respectively).

