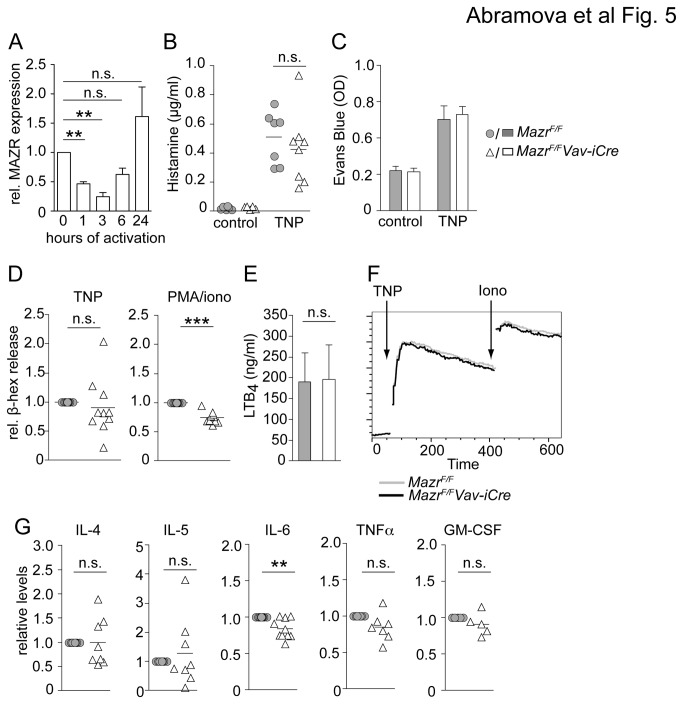
Figure 5. Minor defects in early and late mast cell effector functions in the absence of MAZR.
(A) Diagram shows qRTPCR analysis of Mazr expression in resting anti-TNP IgE-primed BMMCs and in BMMCs activated for the indicated time points with TNP. Expression levels are normalized to Hprt expression and levels in IgE-primed non-activated mast cells were set as 1 (100%). Data show summary of three samples analyzed. Mean ± SEM is shown.
(B) Plasma histamine levels in a systemic anaphylaxis model are shown. Mazr F/F and Mazr F/F Vav-iCre mice were primed (i.v.) with anti-TNP IgE, challenged 24 hours later by i.v. injection of TNP or PBS. Serum was collected 2 minutes post-injection and histamine levels were determined by ELISA, n=7.
(C) Absorbance (OD) of Evans Blue dye extravasated in a passive cutaneous anaphylaxis model from the ears of Mazr F/F and Mazr F/F Vav-iCre mice is shown. Mice were injected with PBS and anti-TNP IgE into left and right ear, respectively, and 24 hours later mice were challenged by i.v. injection with TNP/Evans Blue dye. Extravasation of Evans Blue dye in the ear was measured 4 hours later. Diagram shows summary of 9 mice. Mean ± SEM is shown.
(D) Anti-TNP-IgE-primed Mazr F/F and Mazr F/F Vav-iCre BMMCs were activated for 10 min with TNP or PMA/ionomycin. β-Hexosaminidase release levels of Mazr F/F BMMCs were set to 1 (n=10).
(E) Anti-TNP-IgE-primed Mazr F/F and Mazr F/F Vav-iCre BMMCs were activated for 60 min with TNP. LTB4 levels were determined by ELISA. Mean ± SEM is shown. (n=4).
(F) Flow cytometric analysis of calcium flux in anti-TNP-IgE-primed Mazr F/F and Mazr F/F Vav-iCre BMMCs that have been activated with TNP. Data are representative of 3 independent experiments.
(G) Cytokine production of anti-TNP-IgE-primed Mazr F/F and Mazr F/F Vav-iCre BMMCs that were activated by plate-bound TNP for 24 hours (at least 5 independent mast cell batches were analyzed). Cytokine production of Mazr F/F BMMCs was set to 1.

