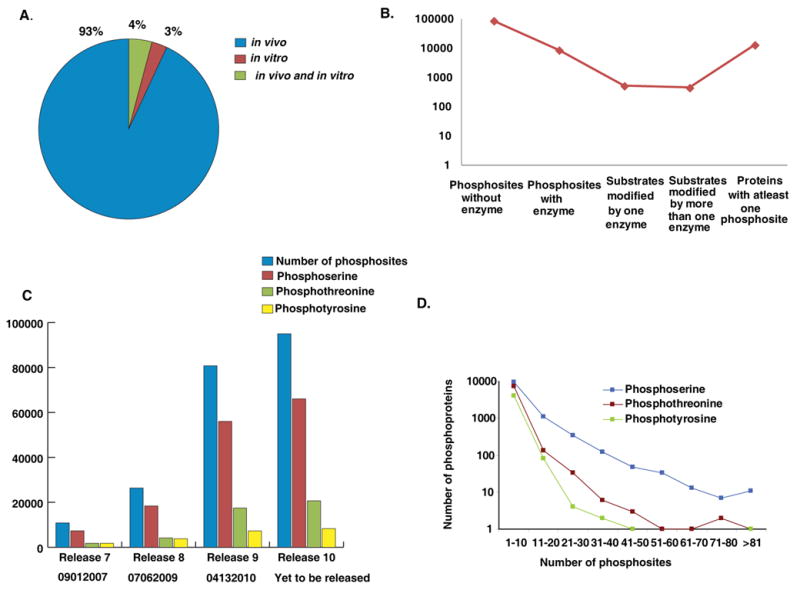
Figure 2. Overview of phosphoserine, phosphothreonine and phosphotyrosine data in HPRD.

A) Distribution of phosphorylation data in HPRD derived from in vivo and in vitro experiments B) Fraction of phosphosites in HPRD with an annotated upstream enzyme; C) Exponential increase of HPRD phosphorylation data over the last four releases; D) Distribution of protein groups based on number of phosphoserine, phosphothreonine and phosphotyrosine sites they harbor.
