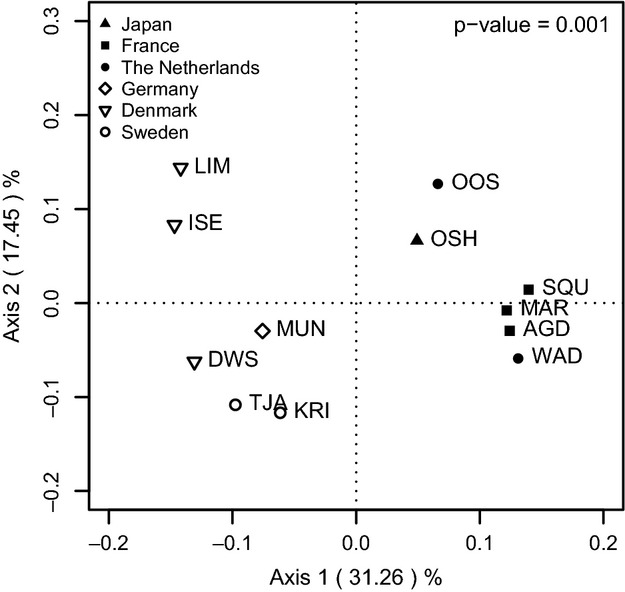
Figure 3.

Projection of sample centres of gravity on the first factorial plane of a correspondence analysis (CA) on the matrix of allele frequencies at 278 loci (30 SNPs, 8 microsatellites and 240 AFLPs). White and black symbols indicate northern and southern populations, respectively.
