Figure 5.

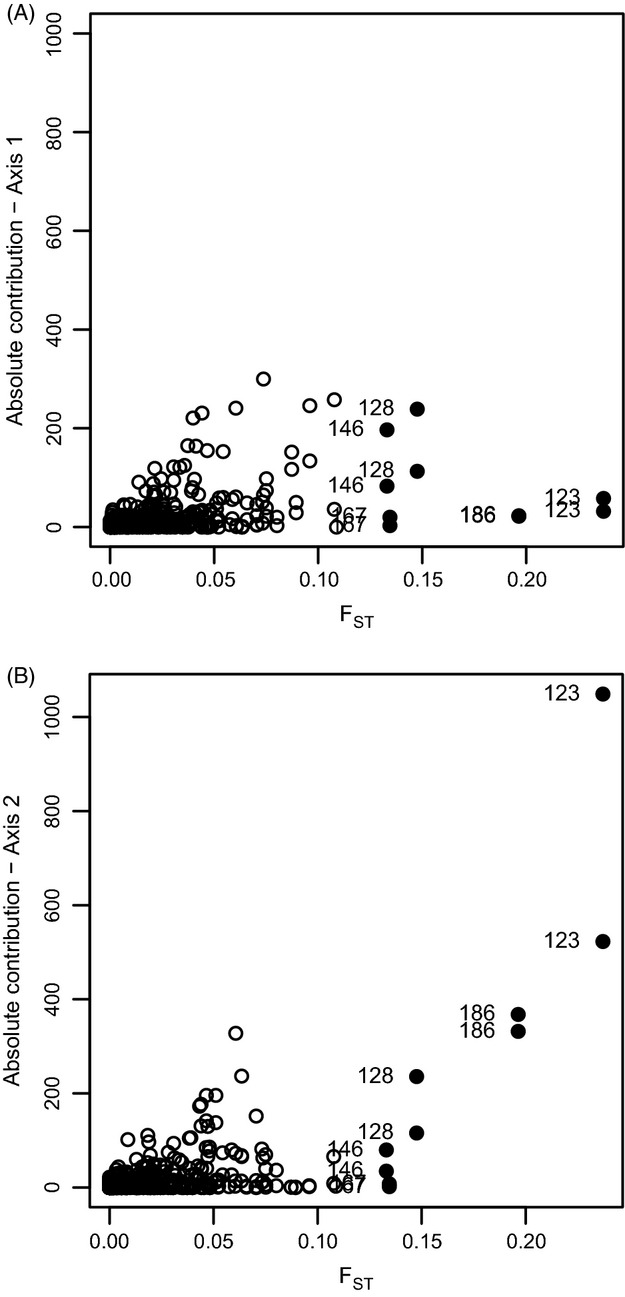
Absolute contributions of the decomposition of contribution for the alleles plotted against FST values for axes 1 (A) and 2 (B) for the 240 AFLP loci. The 5 outlier loci are plotted as black circles.

Absolute contributions of the decomposition of contribution for the alleles plotted against FST values for axes 1 (A) and 2 (B) for the 240 AFLP loci. The 5 outlier loci are plotted as black circles.