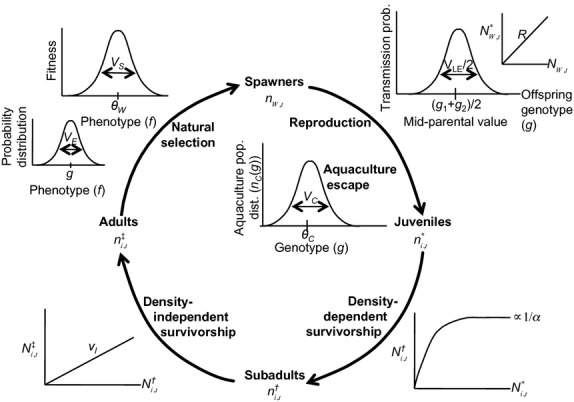
Figure 1.

Model illustration given the default life cycle order and aquaculture escape timing (eqns 1–7). Graphs illustrate the dynamics at each step, with one full cycle for each generation (stages indicated on the circle, wild population dynamics outside the circle, and aquaculture population dynamics inside the circle). See Table 1 for definitions of the parameters indicated. Model explorations include changing the order of aquaculture escape, density-dependent survival, density-independent survival, and natural selection.
