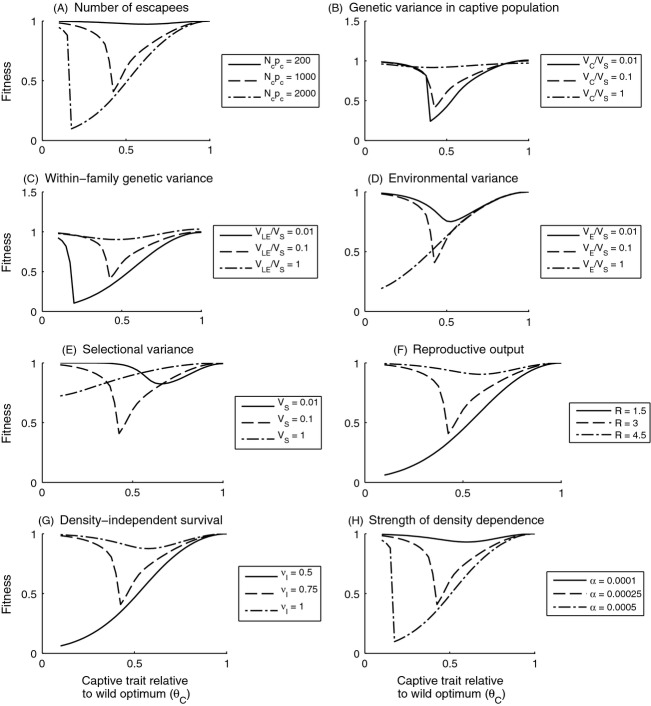
Figure 6.
Effect of different parameter values on fitness, plotted relative to the baseline fitness in equivalent simulations without aquaculture escapees. The broken lines indicates the outcome under default parameter values (Table 1), with the solid and dash-dotted lines indicating the effect of decreasing or increasing the value of the indicated parameter, while all others are held constant. Values for the variances in panels (B–D) are expressed relative to the value of the variance in the selection surface VS (inverse of selection strength). The equivalent plots for population size and recovery time are in Supplementary Information Appendix C.

