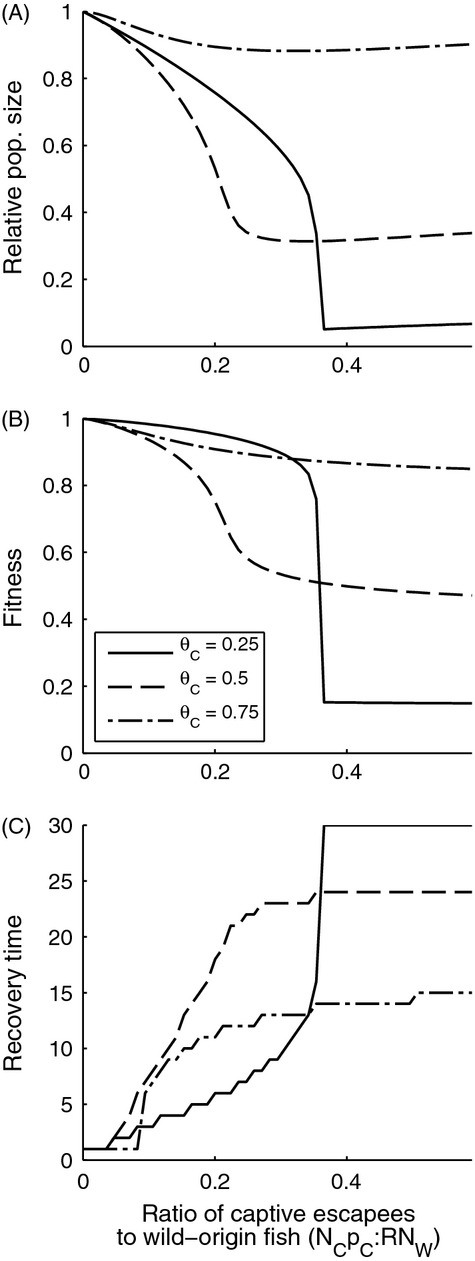
Figure 7.

Effect of the ratio of captive escapees to wild-origin fish (per generation) under different values for the mean aquaculture genotype (θC, relative to the wild optimum phenotype of θW = 1). The x-axis value of captive-origin:wild-origin population sizes is measured at escape. For an explanation of y-axis values, see Fig. 2.
