Figure 3.

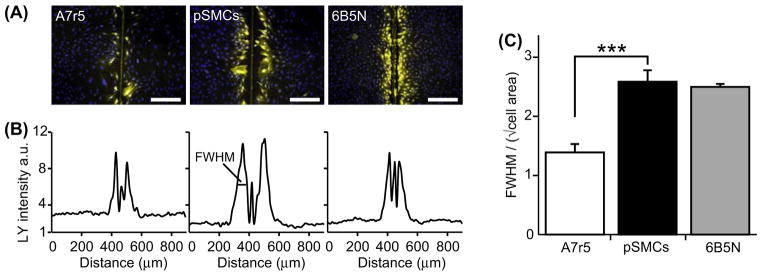
Quantification of GJ dye-coupling by intercellular Lucifer Yellow diffusion. (A) Scrape-loading and dye transfer of LY (yellow) in A7r5, pSMCs and 6B5N cells (nuclei in blue). The vertical line in the middle of the image is the mark of the scalpel blade used for scrape-loading. Scale bars, 200 μm. (B) Plot of average LY fluorescence intensity in each pixel along the rows within the images in (A). (C) The distance of LY diffusion was quantified by taking the full width at half maximum (FWHM) of the plots in (B) divided by the square root of the average cell area. The spread of LY in pSMCs was significantly higher than in A7r5 cells and similar as in 6B5N cells.
