
Figure 4. Non-clonal c-kit+/Lin− cells undergo vascular differentiation and start to respond to angiotensin II (Ang II) via AT1a receptor.
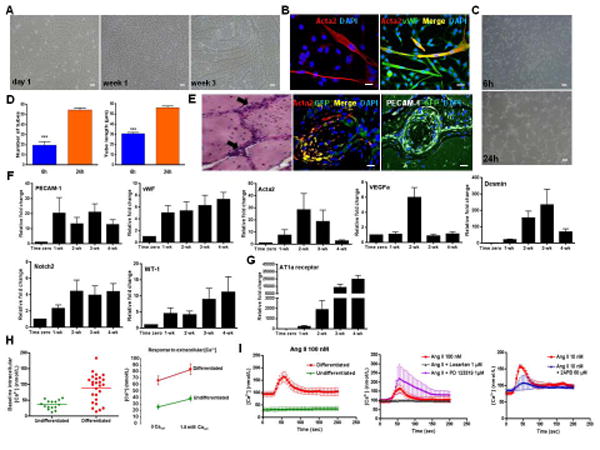
(A) Monolayer of c-kit+ cells in endothelium medium (EGM-2) grown for the indicated period of time. Myotube-like structures were observed after 3 weeks.
(B) Myotube-like structures stained for Acta2 and co-localized with vWF.
(C) In vitro endothelial differentiation assessed by the Matrigel tube formation assay.
(D) Matrigel assay produced more (***P<0.0001) and longer (***P<0.0001) tubes at 24h compared to 6h. Pictures represent three different experiments each done in triplicate.
(E) In vivo vascular differentiation. GFP-labeled c-kit+ cells embedded in Matrigel and injected into NOD-SCID mice. H&E staining of the implants containing c-kit+/Lin− cells showed network connections (arrows). Matrigel plug stained for GFP, Acta2 and PECAM-1 (platelet-endothelial cell adhesion molecule-1).
(F) Relative fold change with time in EGM-2 of PECAM-1 (P=0.055), vWF (P=0.008), Acta2 (P=0.48), VEGFa (P=0.0022), Desmin (P<0.0001), Notch2 (P=0.034), and WT-1 (P=0.0001). qPCR data reflects five different experiments each done in triplicate.
(G) Relative fold change of AT1a receptor with time in EGM-2 (P<0.0001).
(H) Differentiated cells exhibited higher intracellular calcium (Ca2+) concentration at baseline and their response to extracellular Ca2+ was more pronounced compared to undifferentiated cells (P<0.0001).
(I) Differentiated (red line) and undifferentiated cells (green line) responses to Ang II (100 nM) stimulus (P<0.0001). The response to Ang II (red line) was selectively blocked by Losartan (1 μM; blue line) suggesting that Ang II is mediated by AT1a receptor (P=0.0008); AT2 receptor antagonist, PD123319 (1 μM; purple line), had no effect on Ang II response. 2-APB (blue line; 60 μM), a specific blocker of inositol-1,4,5-triphosphate (IP3) receptor, reduced the increase in intracellular Ca2+ caused by Ang II (P<0.0001).
Cell nuclei are stained blue with DAPI. Scale bars represent 50 μm A,C and E (H&E staining) and 20 μm for confocal images (B,E). Error bars represent mean ± SD for (D) and mean ± SEM for (F,G).