
Figure 6. Non-clonal and clonal-derived c-kit+ cells form nephrospheres.
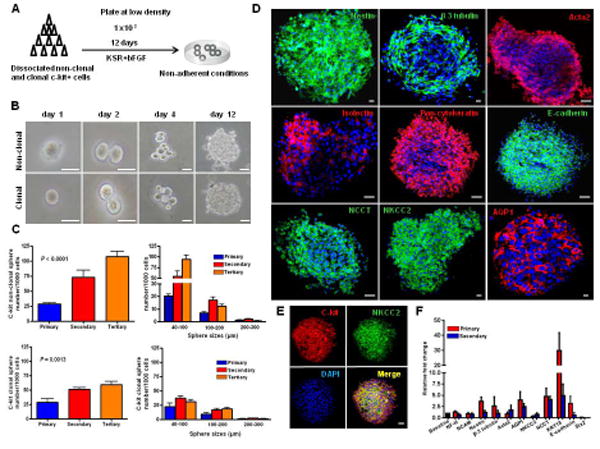
(A) Experimental procedure used to generate nephrospheres from c-kit+ cells.
(B) An example of clonal sphere growth obtained from non-clonal and clonal c-kit+ cells.
(C) Primary spheres were formed at a frequency of ∼2.5% of the initially plated cells. When dissociated to single cells, secondary and tertiary spheres arose from both non-clonal and clonal c-kit+ cells, and measured on average 40-100 μm.
(D,E) Nephrospheres stained for nestin, β-3 tubulin, Acta2, isolectin, pan-cytokeratin, E-cadherin, NCCT, NKCC2, and AQP1. C-kit costained for NKCC2.
(F) Gene expression by real-time PCR analyzed by the fold change (2ΔΔCt) in primary and secondary spheres. Nestin (P=0.008), NCCT (P=0.043), KRT18 (P=0.008) were significantly up-regulated, while SIX2 was down-regulated (P<0.0001).
Scale bars represent 50 μm (B) and 20 μm for confocal images (D,E). Error bars represent mean ± SEM.