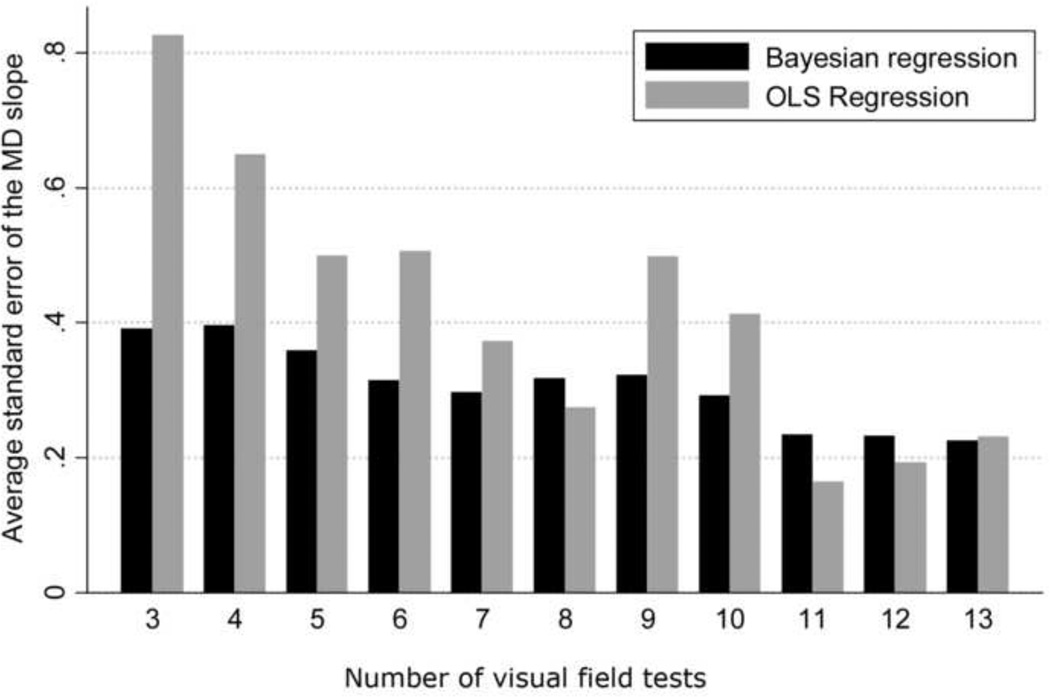
Figure 6.
Bar plot illustrating the differences between the Bayesian and ordinary least squares (OLS) regression methods in the average standard errors of the slopes of mean deviation (MD) change over time in glaucomatous eyes, according to the number of visual field tests used for calculating the slopes.

